
The dashboard step by step, in pictures taken on a demo workspace: finding your way around, adding a plugin, testing a project with Webship-js and watching a long run. Every plugin page has its own steps under "In pictures".
Add a Webship Workspace plugin from Settings → Plugins
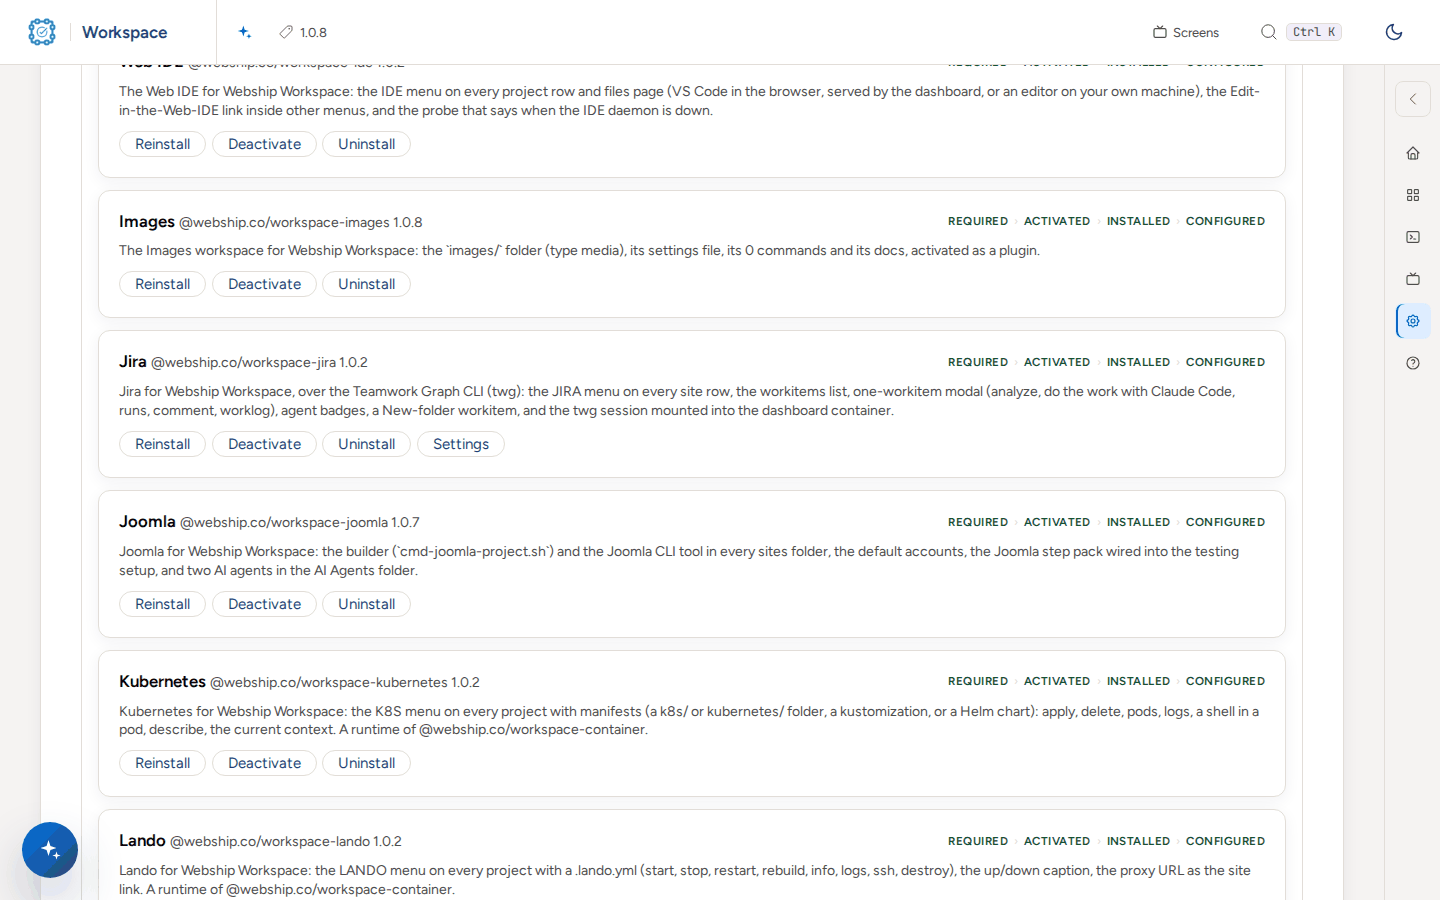
Open Settings → Plugins. Each plugin has a card with its four steps: required, activated, installed, configured.
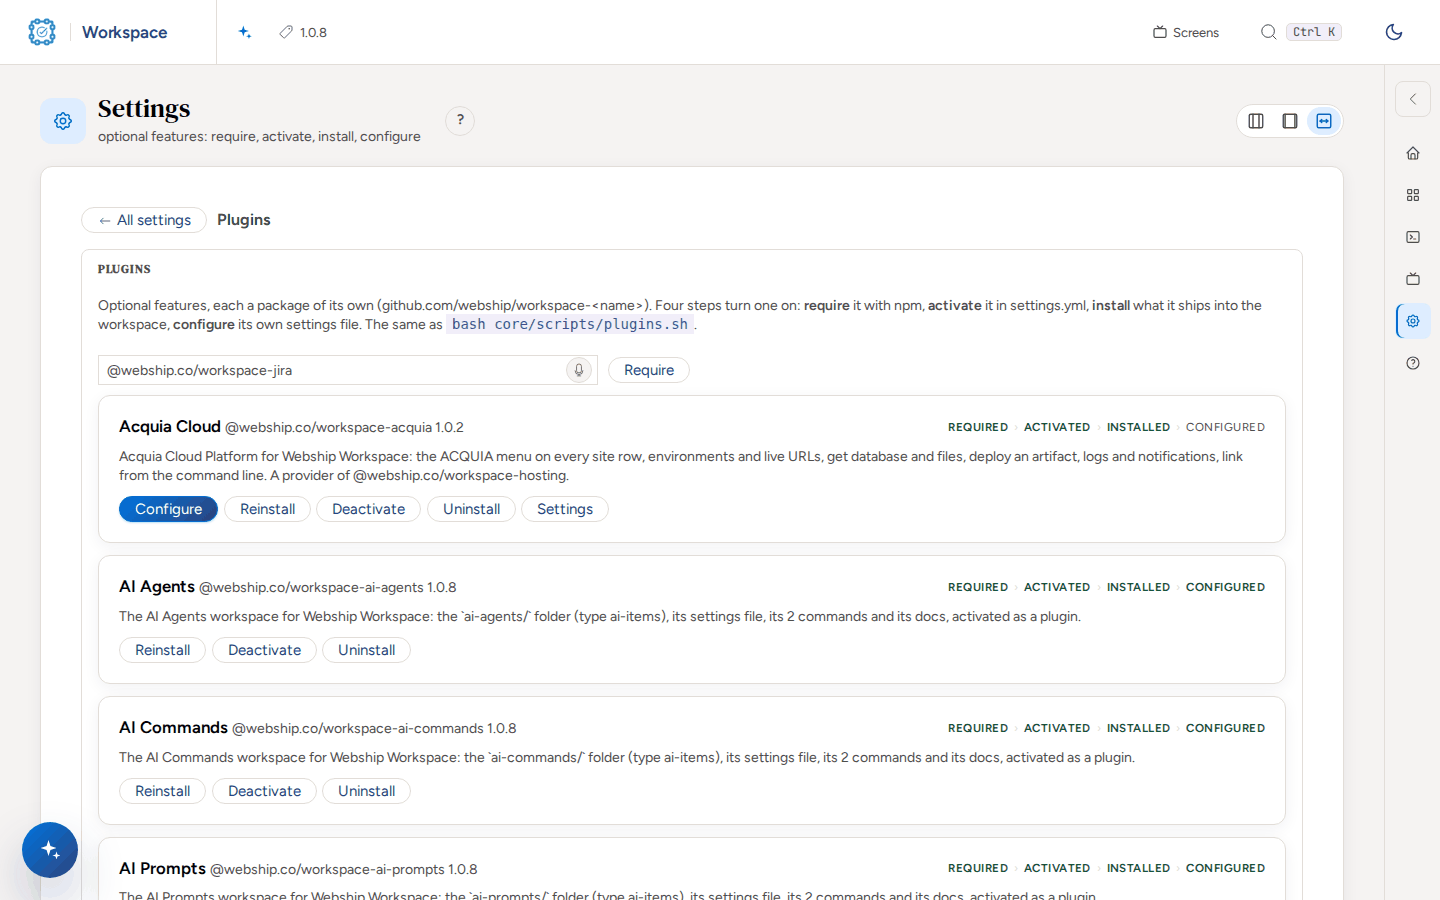
Scroll to the catalogue and press Require beside the plugin you want. You see the npm install in a terminal panel and "Required".
bash core/scripts/plugins.sh --require @webship.co/workspace-jira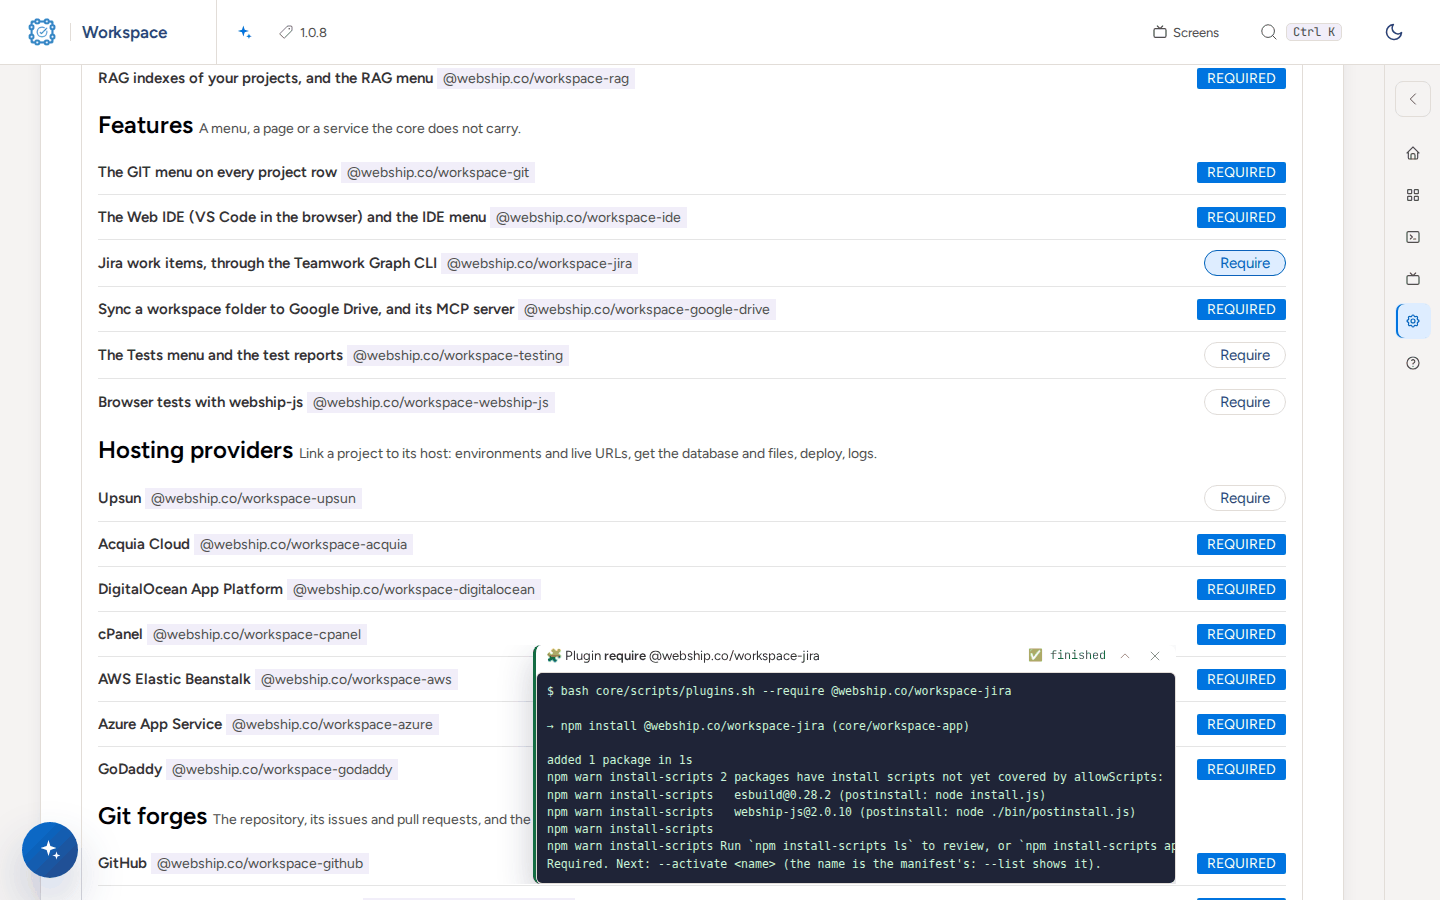
Reload the page and press Activate on the new card. The plugin is switched on in settings.yml.
bash core/scripts/plugins.sh --activate jira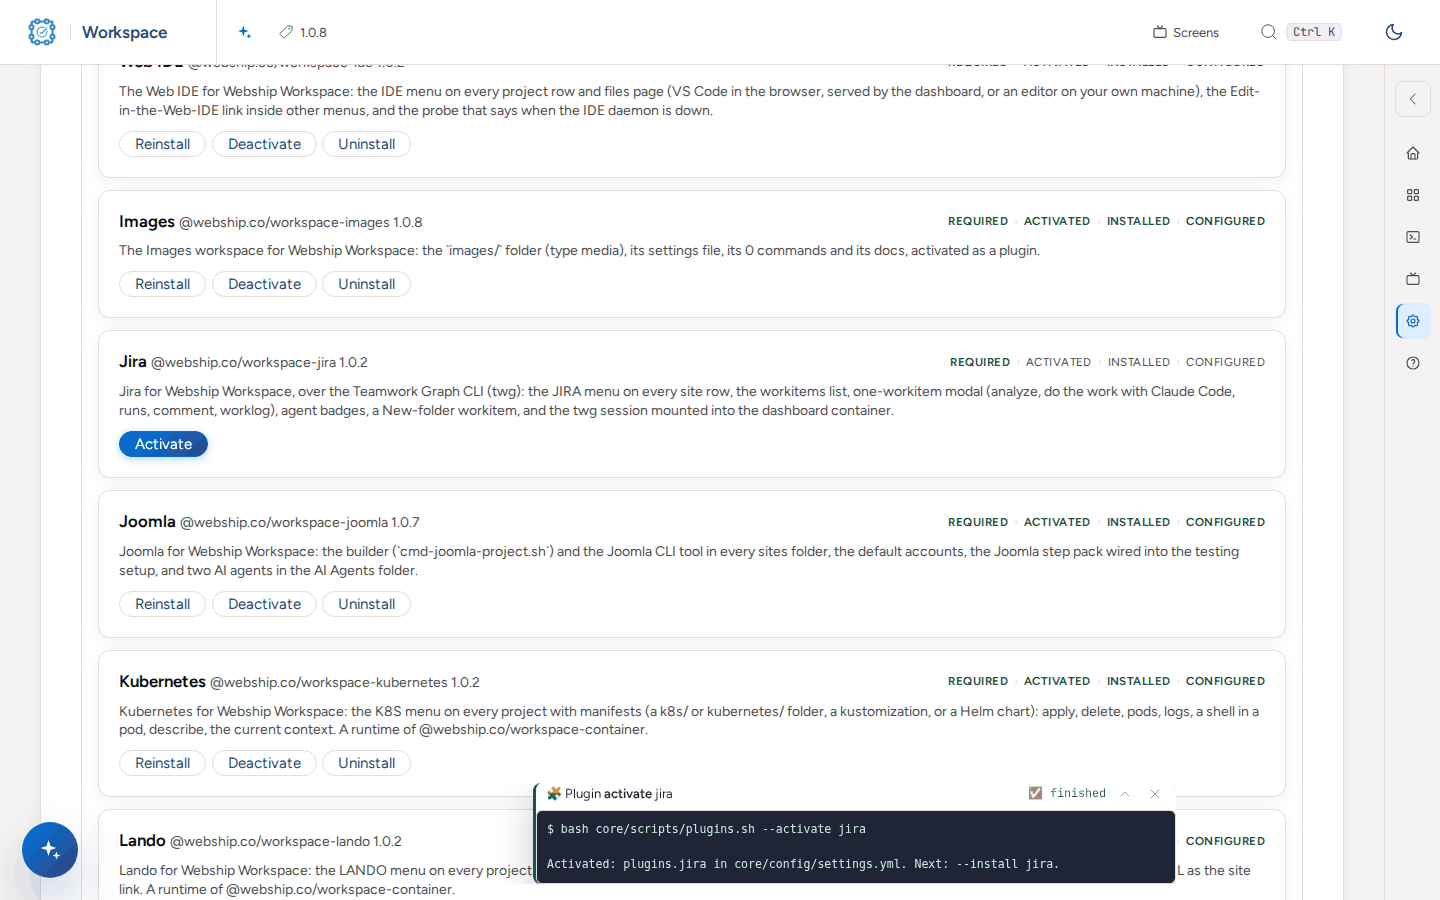
Press Install. The plugin places its files and says what the host still needs.
bash core/scripts/plugins.sh --install jira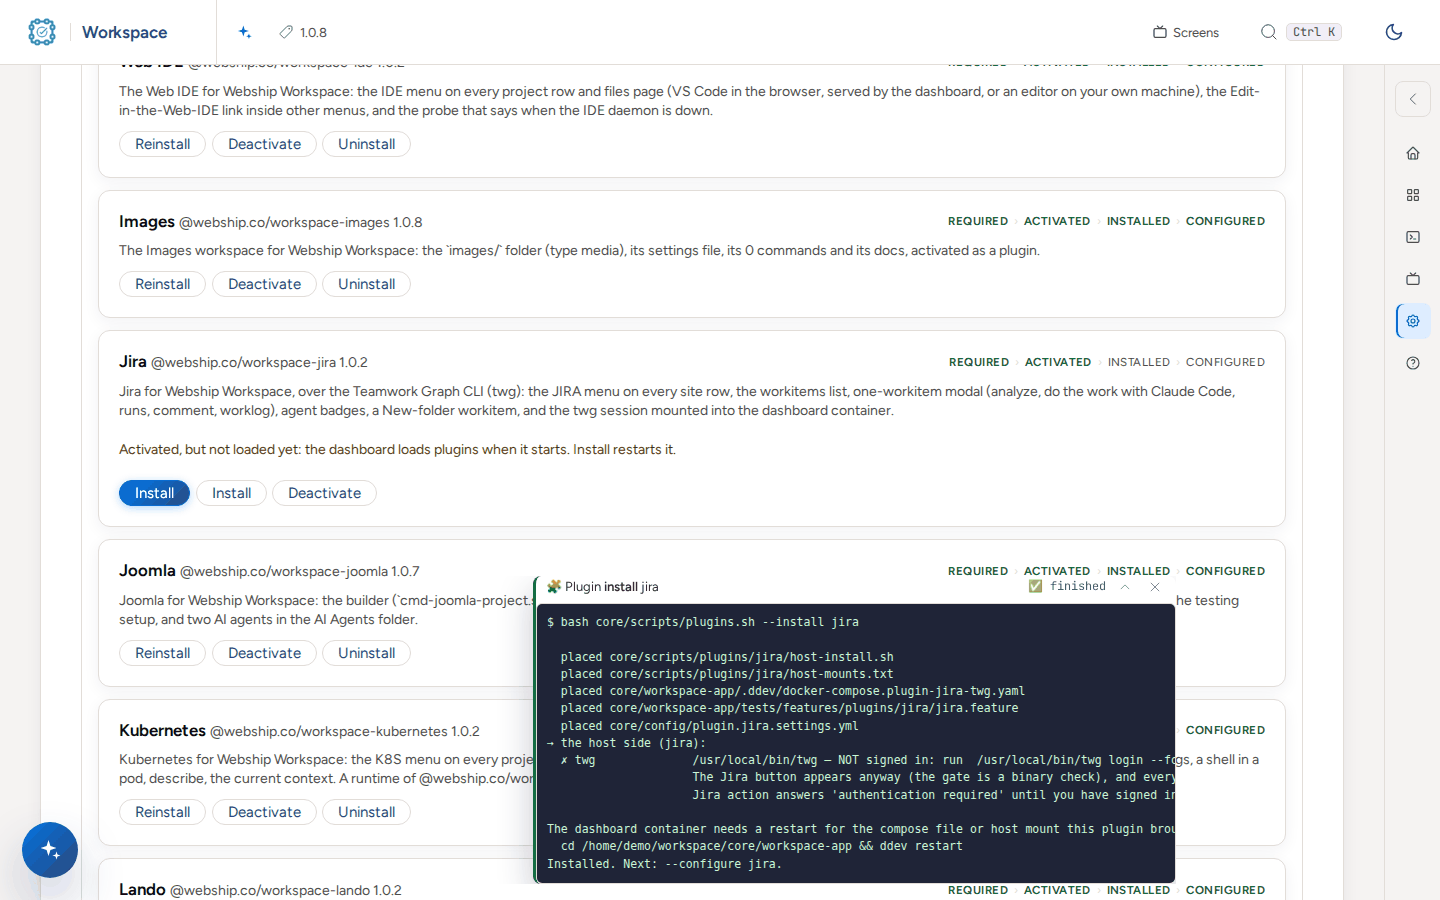
Restart the dashboard so it loads the plugin. The card then shows Settings.
Open the plugin's own settings file and fill it. A plugin with a settings file stays at "next: configure" until then.
bash core/scripts/plugins.sh --configure jira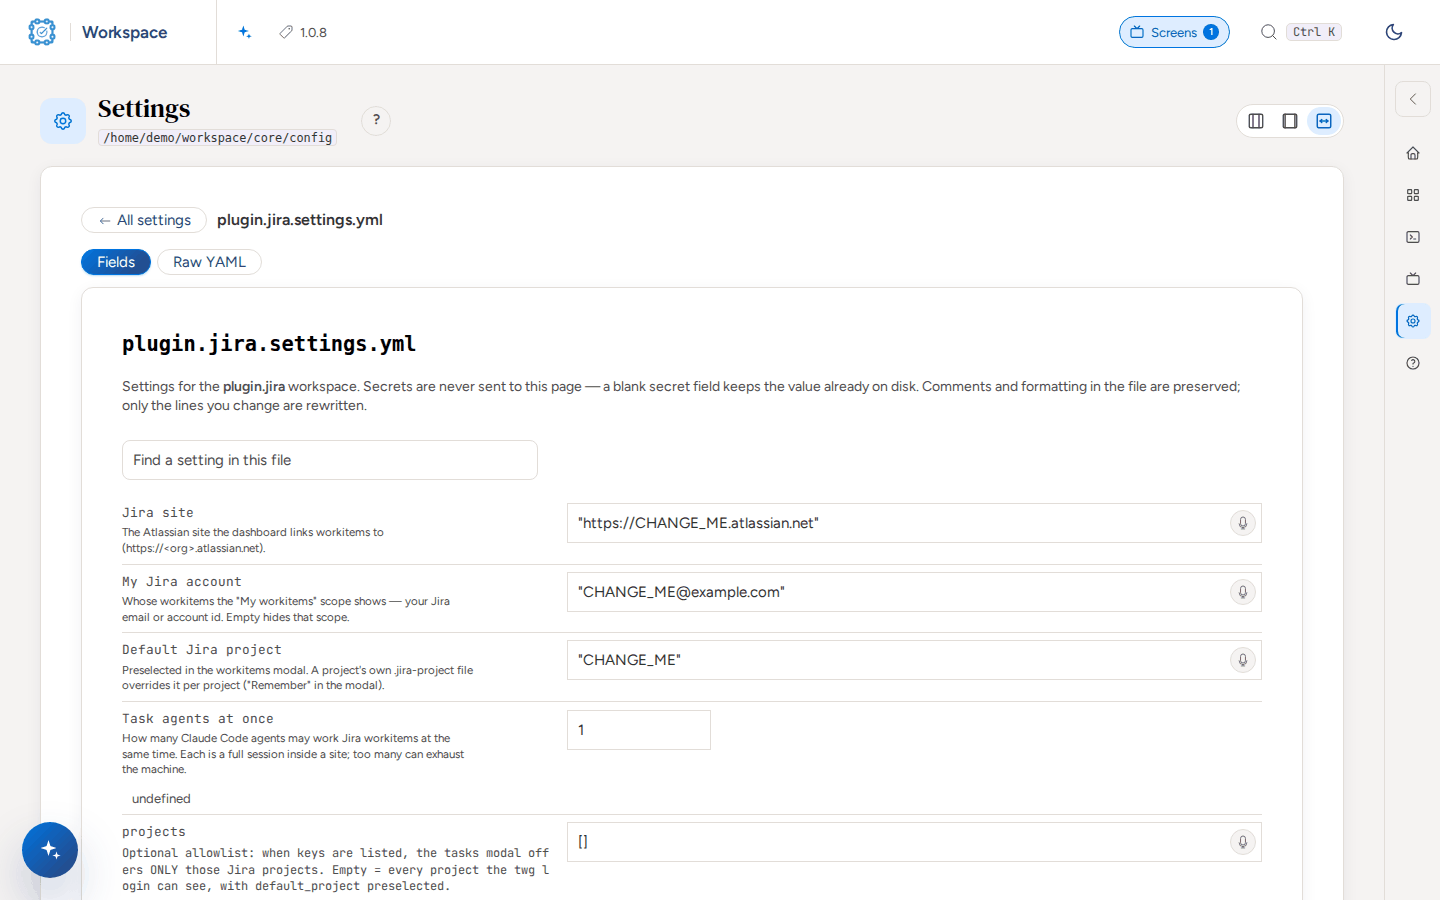
Add a Webship Workspace plugin from the terminal
In the workspace root, require the package. npm installs it into the dashboard.
bash core/scripts/plugins.sh --require @webship.co/workspace-upsun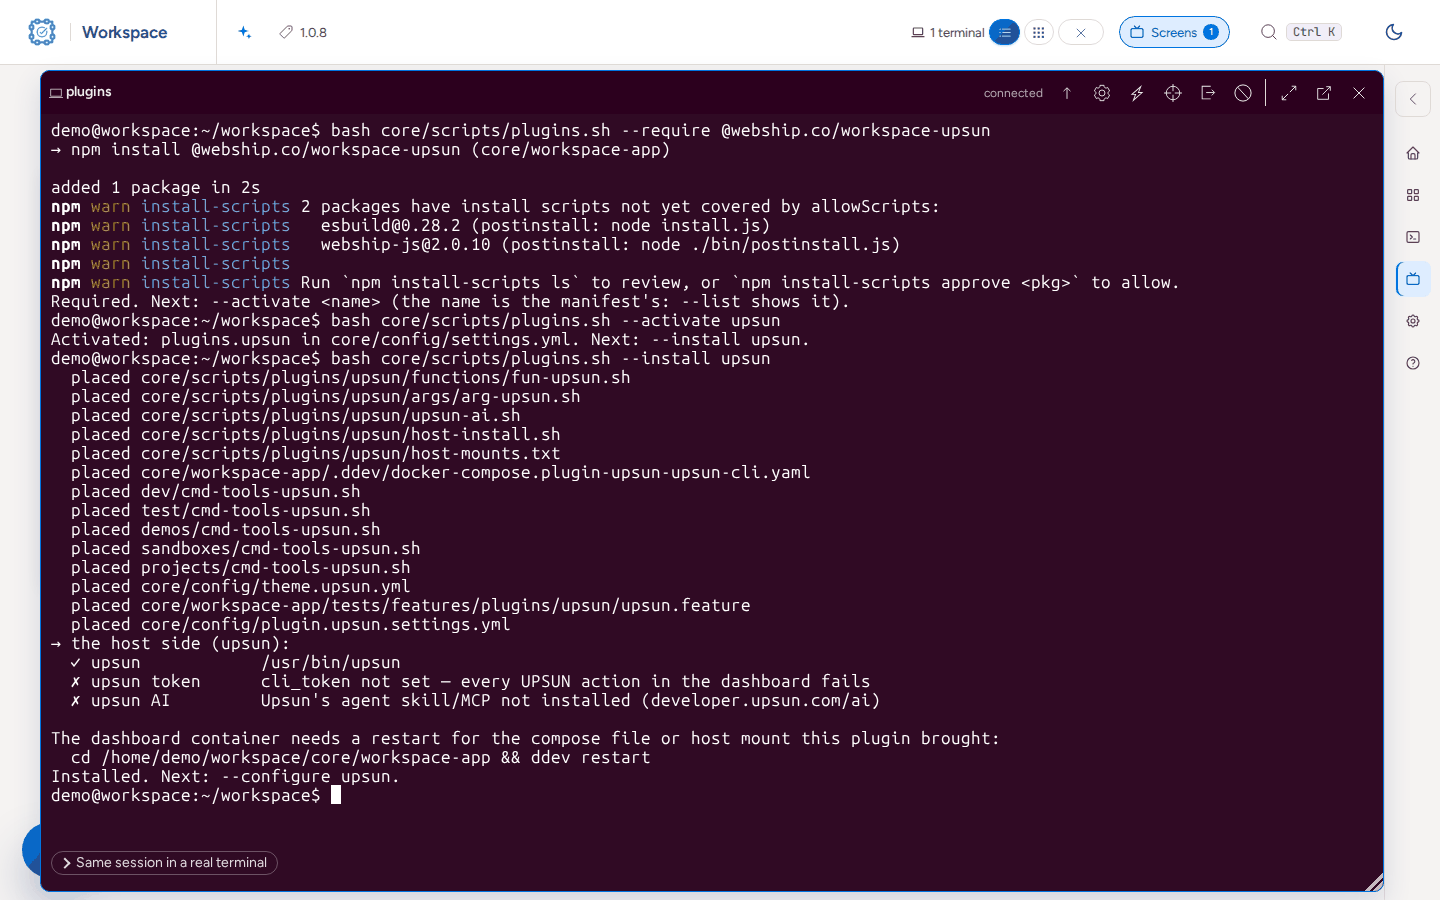
Activate it. It is switched on in core/config/settings.yml.
bash core/scripts/plugins.sh --activate upsunInstall it. You see each file it placed, the host-side checks, and whether the dashboard container needs a restart.
bash core/scripts/plugins.sh --install upsunConfigure it. Its settings file is created from the template and the command prints where to edit it.
bash core/scripts/plugins.sh --configure upsunList the plugins to see the step each is at.
bash core/scripts/plugins.sh --list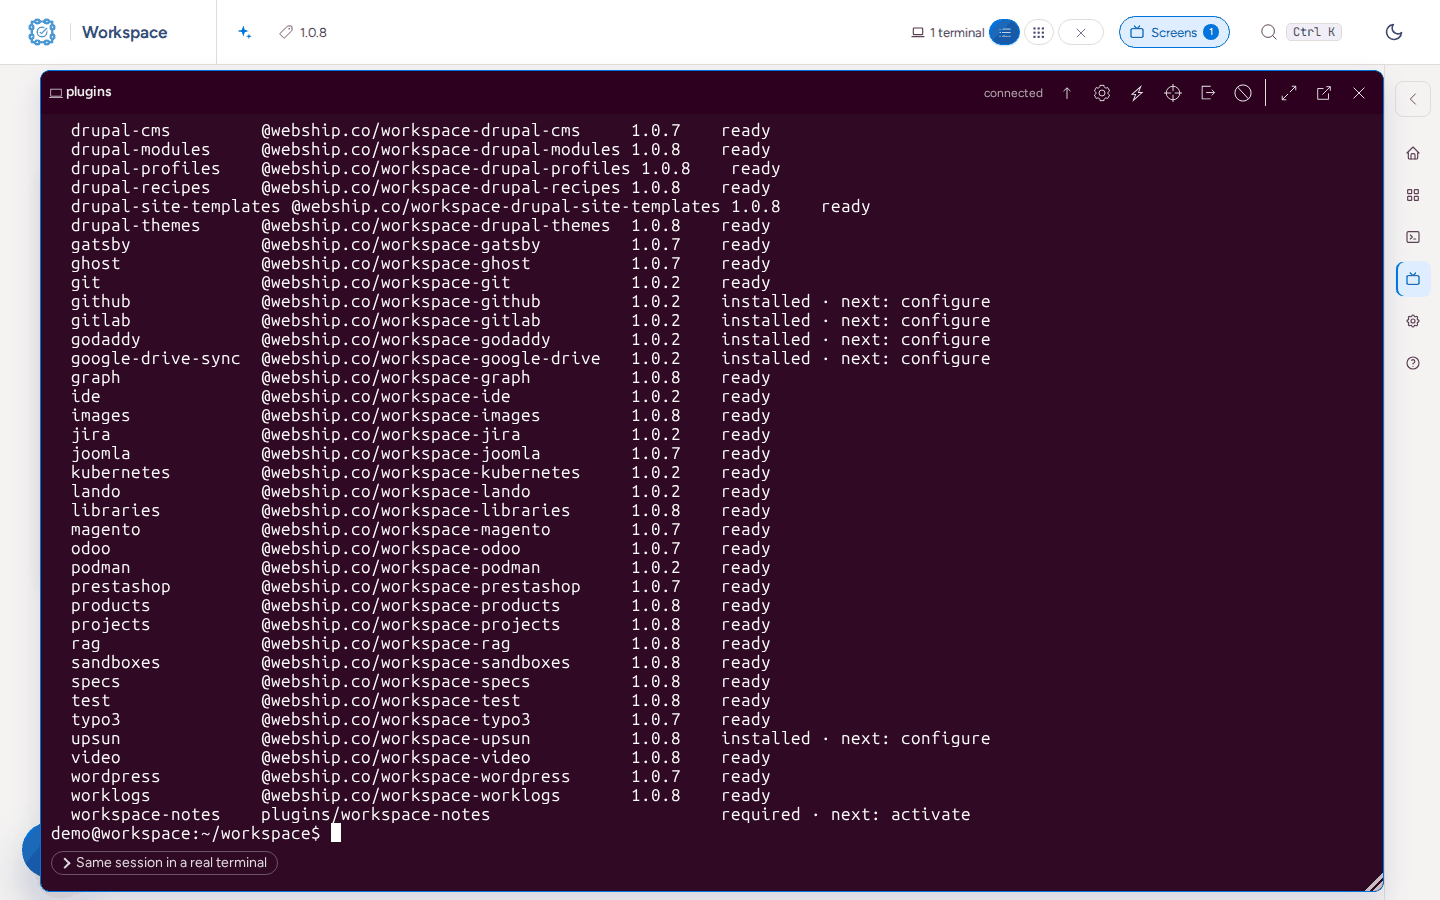
Find your way around
Open the dashboard. The home page has a card for every workspace folder; the AI Assistant is on the left.
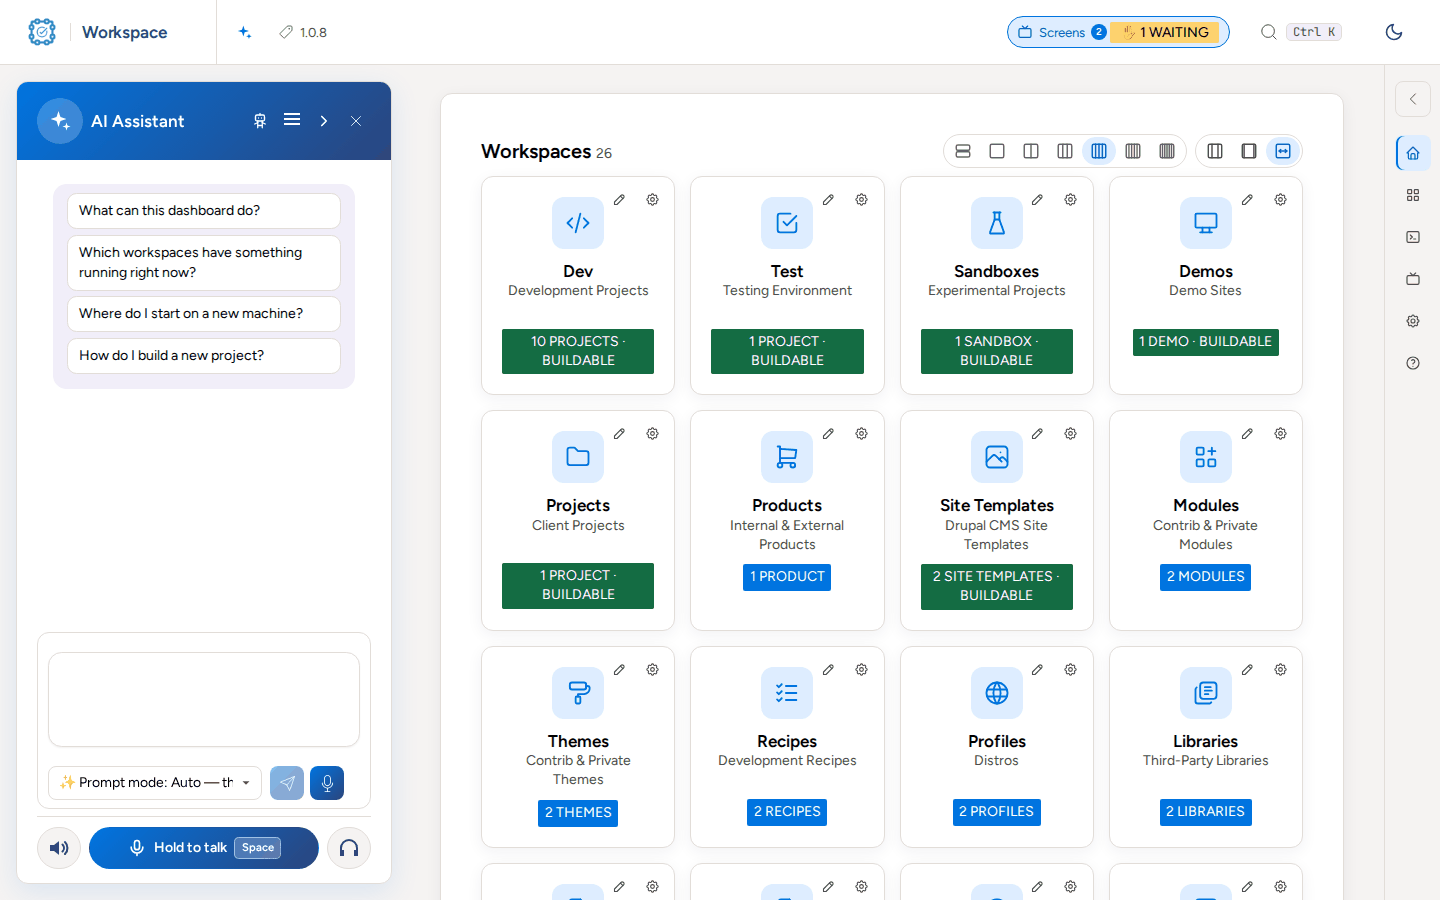
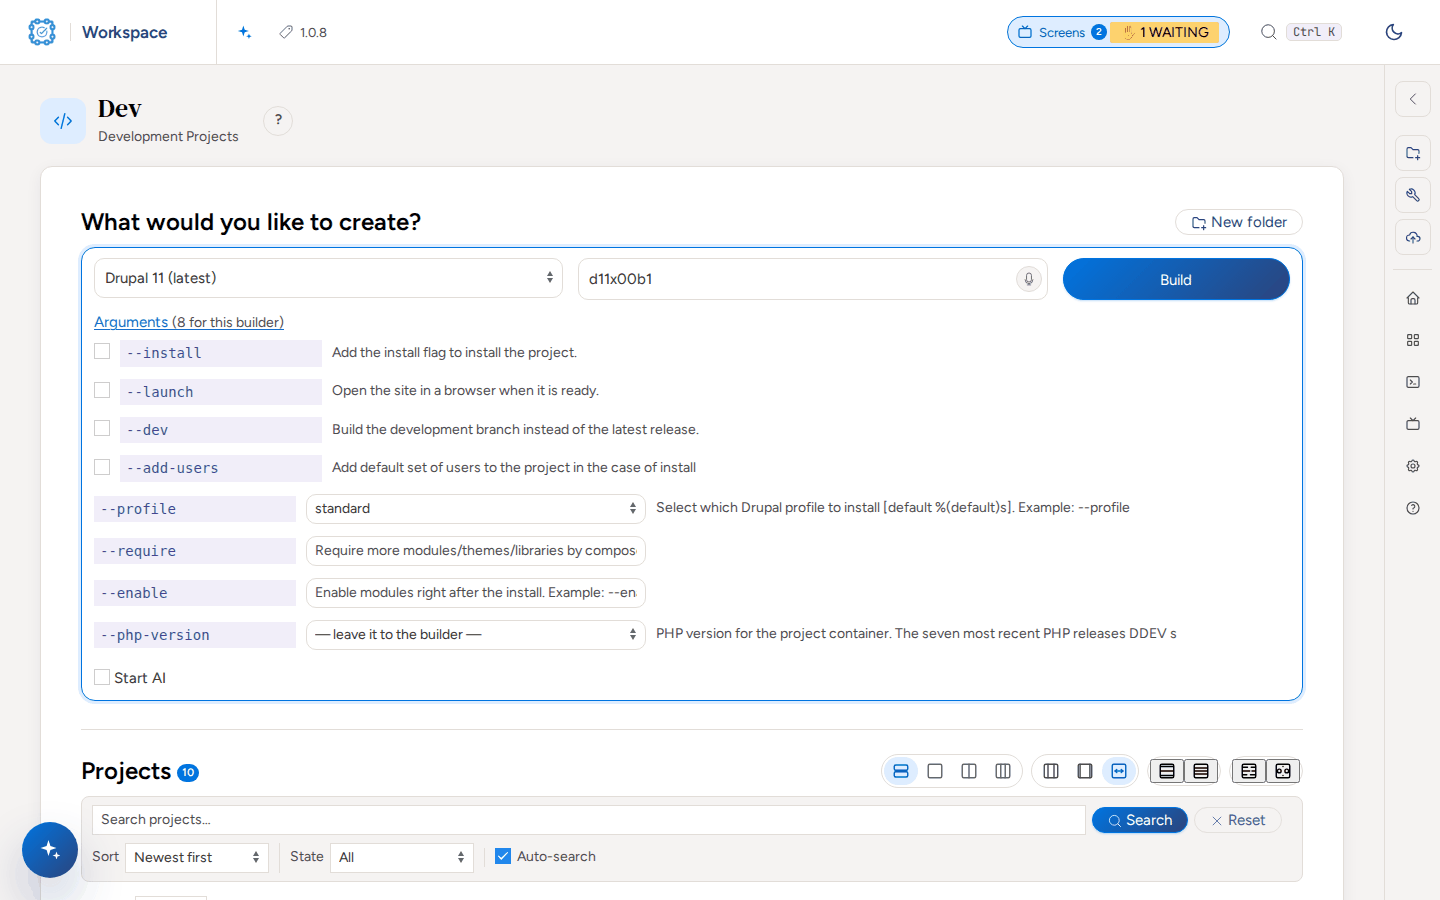
Open a folder of sites, such as Dev. The Build form is at the top and every project is a row below it.
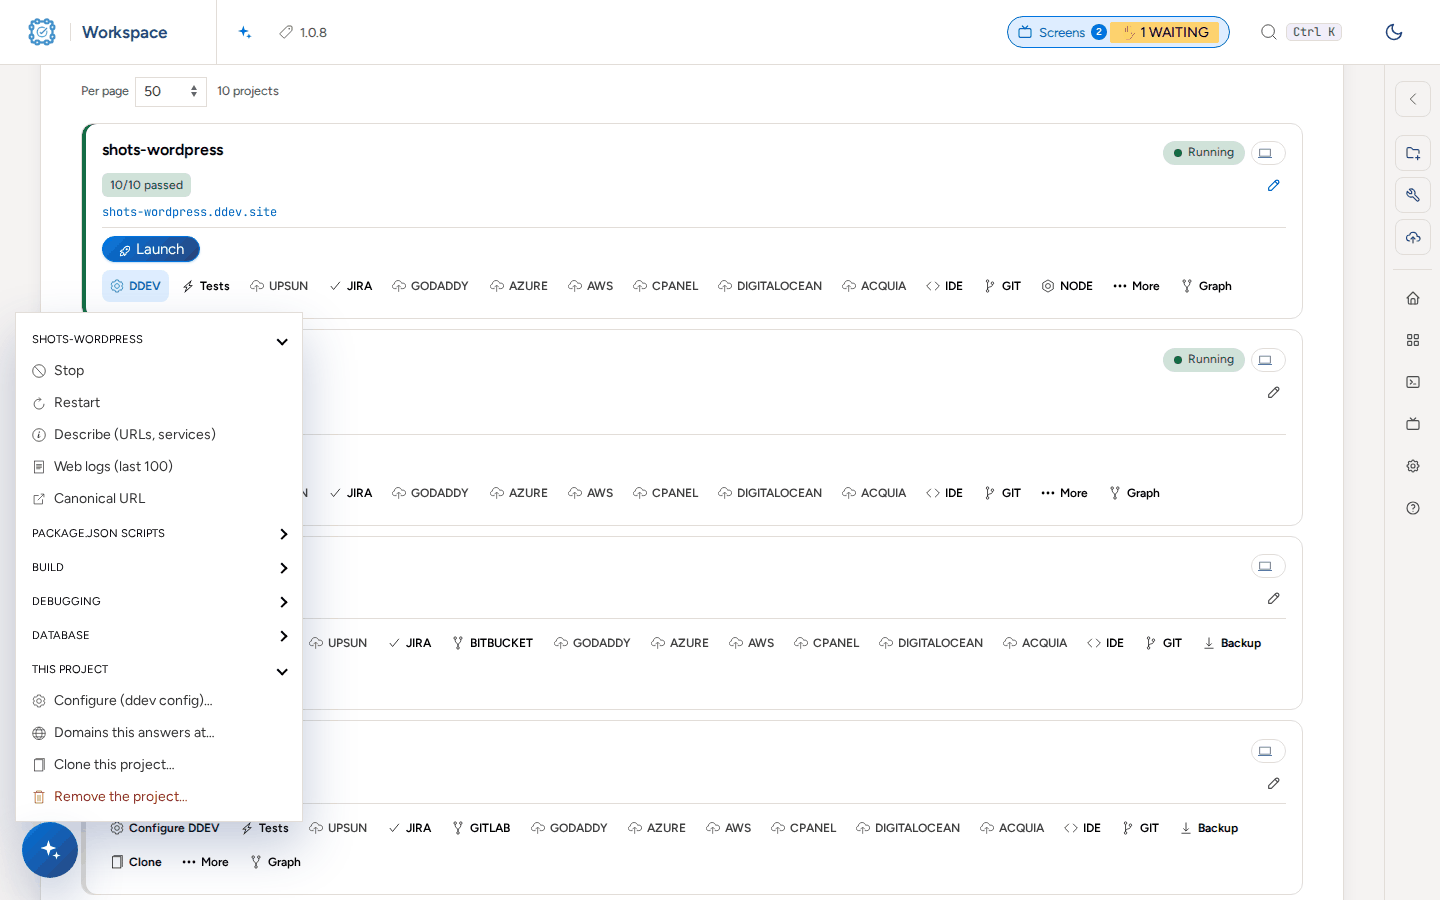
Open a menu on a row, such as DDEV, to act on that project.
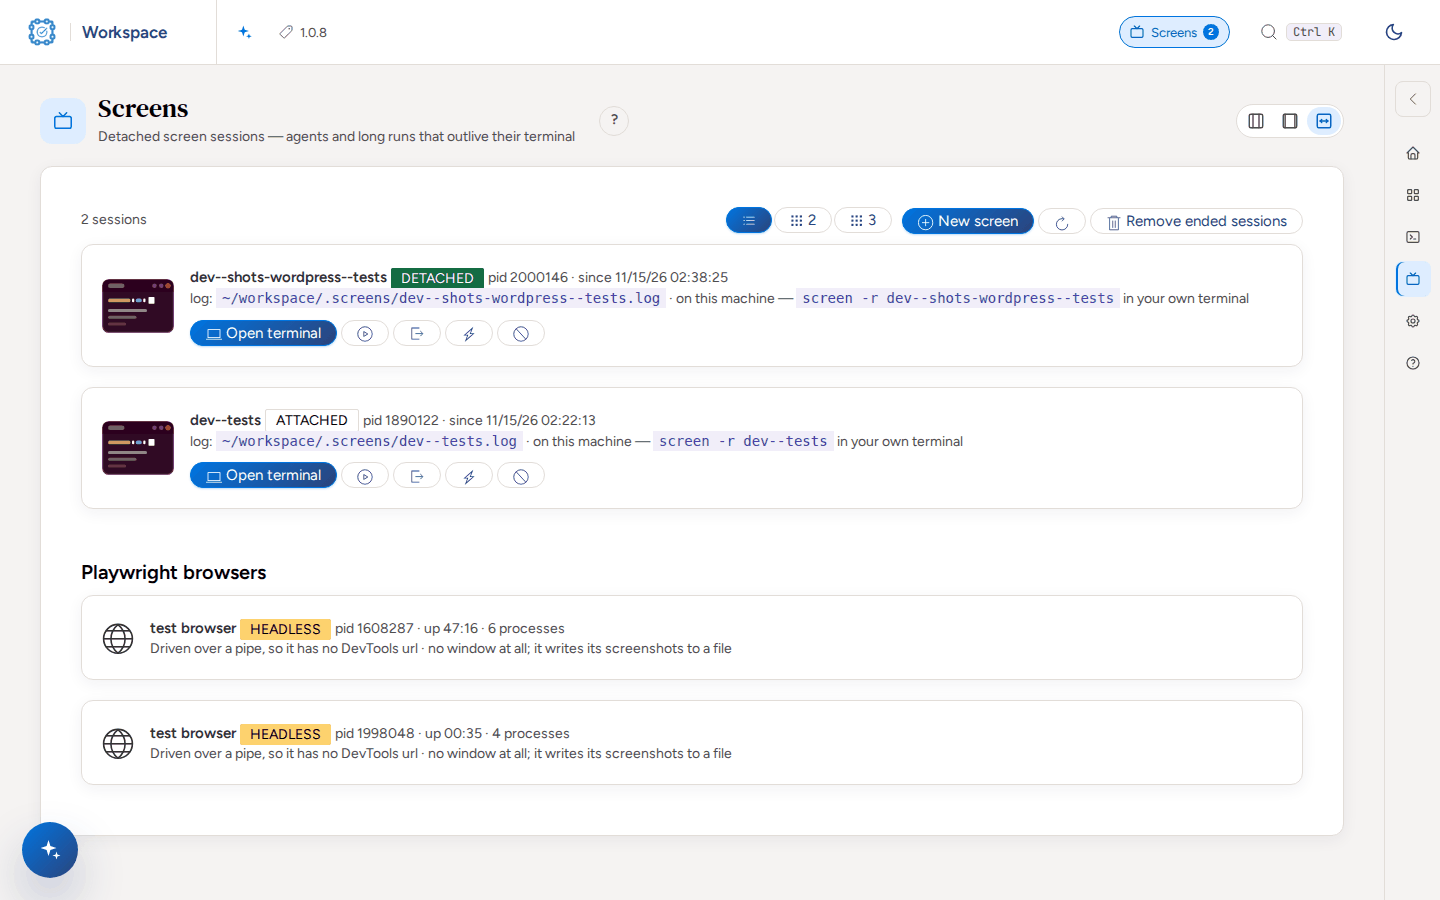
Open Screens in the header to watch long runs and open their terminals.
Open Settings for the dashboard, each plugin and each workspace folder.
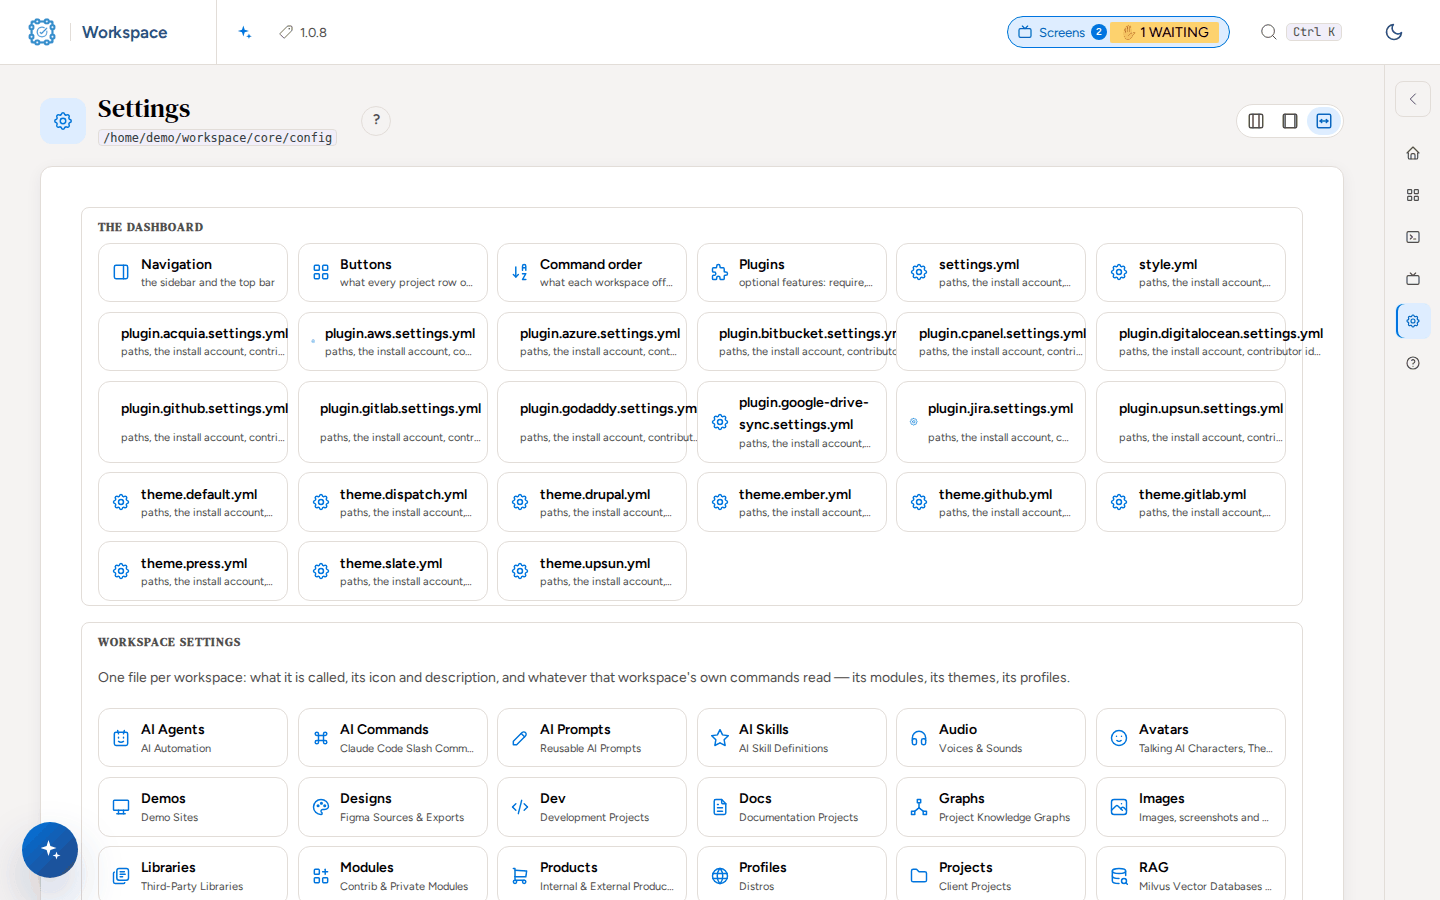
Open a workspace folder's settings to change its name, description and icon.
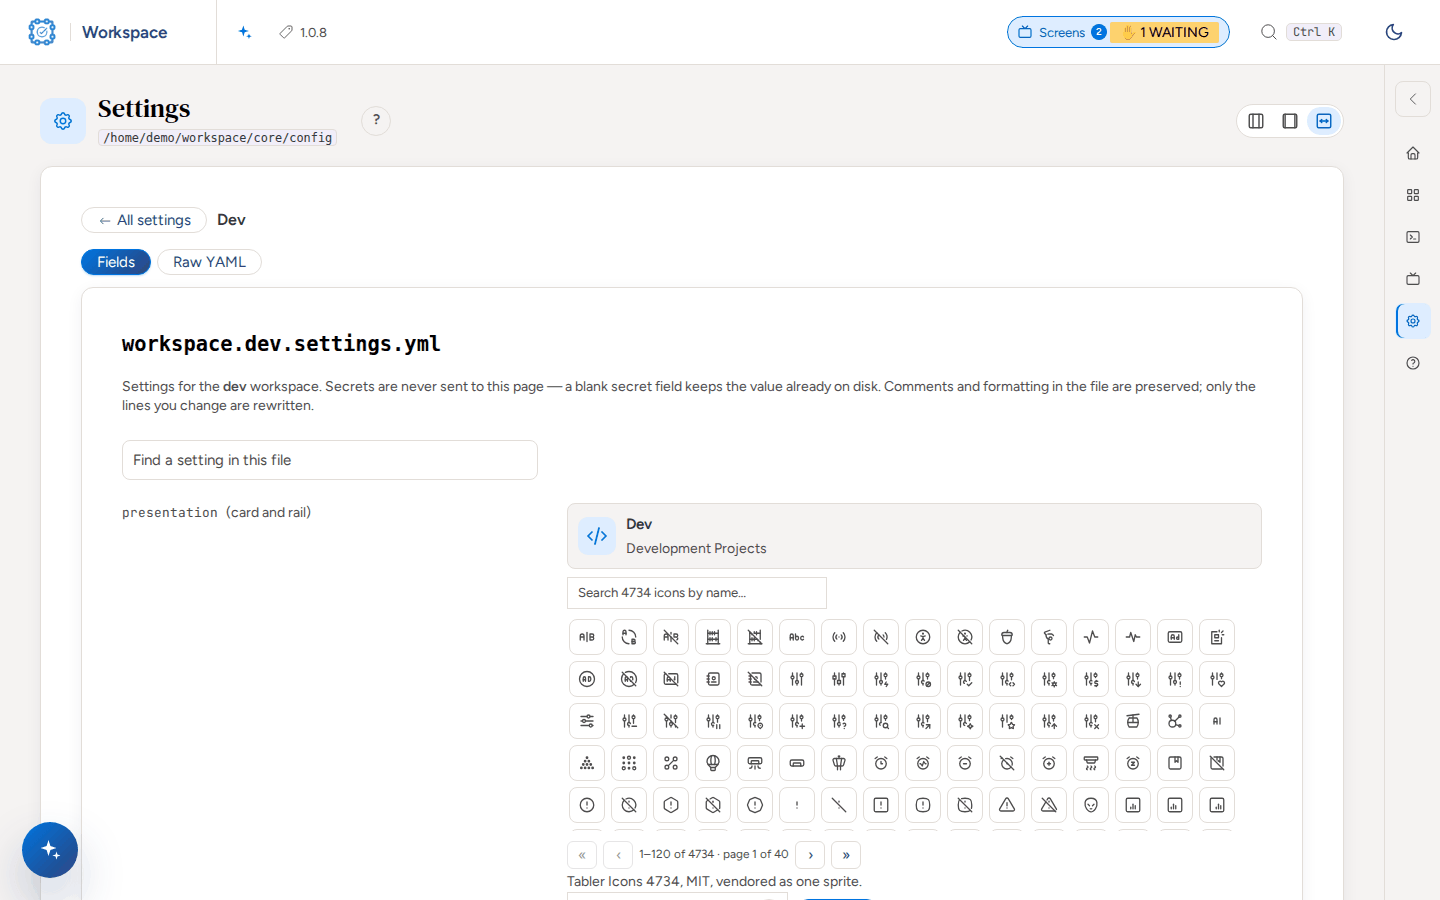
Test a project with Webship-js
Open Tests on the project row. Before the setup it says "not set up".
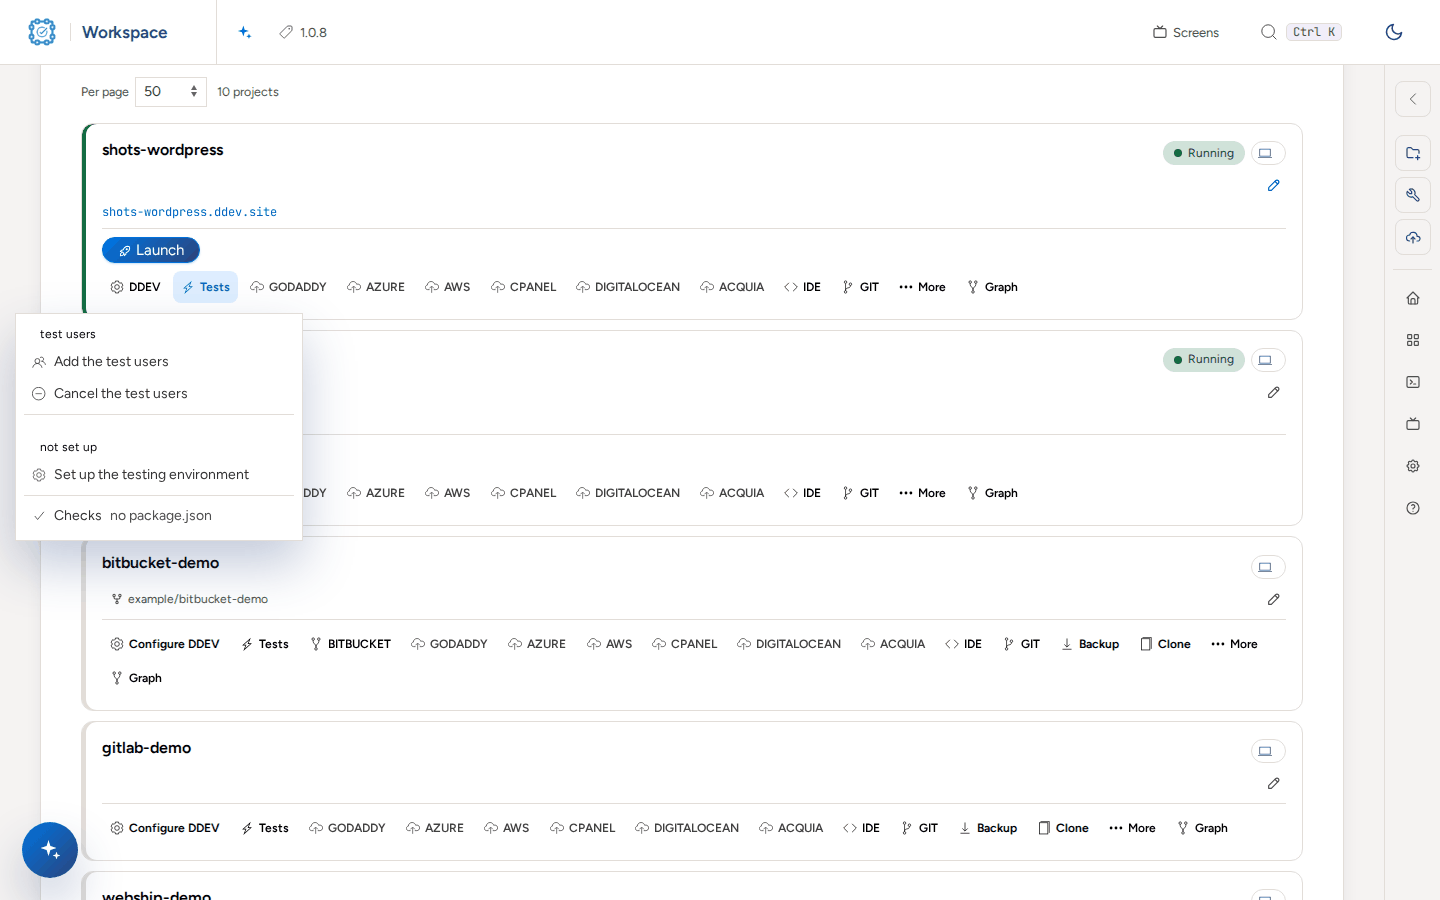
Set up testing: choose Set up the testing environment, or run the command in the folder of the project's workspace. It adds the Webship-js add-on, the JS dependencies and the browser, and restarts the project.
bash cmd-tools-testing.sh shots-wordpressLook at what it added: tests/ with features, reports, screenshots, selectors and step-definitions, and cucumber.js, which loads the Webship-js steps, the step pack of the platform (@webship-js/wordpress-steps here) and the accounts registry.
ls shots-wordpress/tests shots-wordpress/tests/features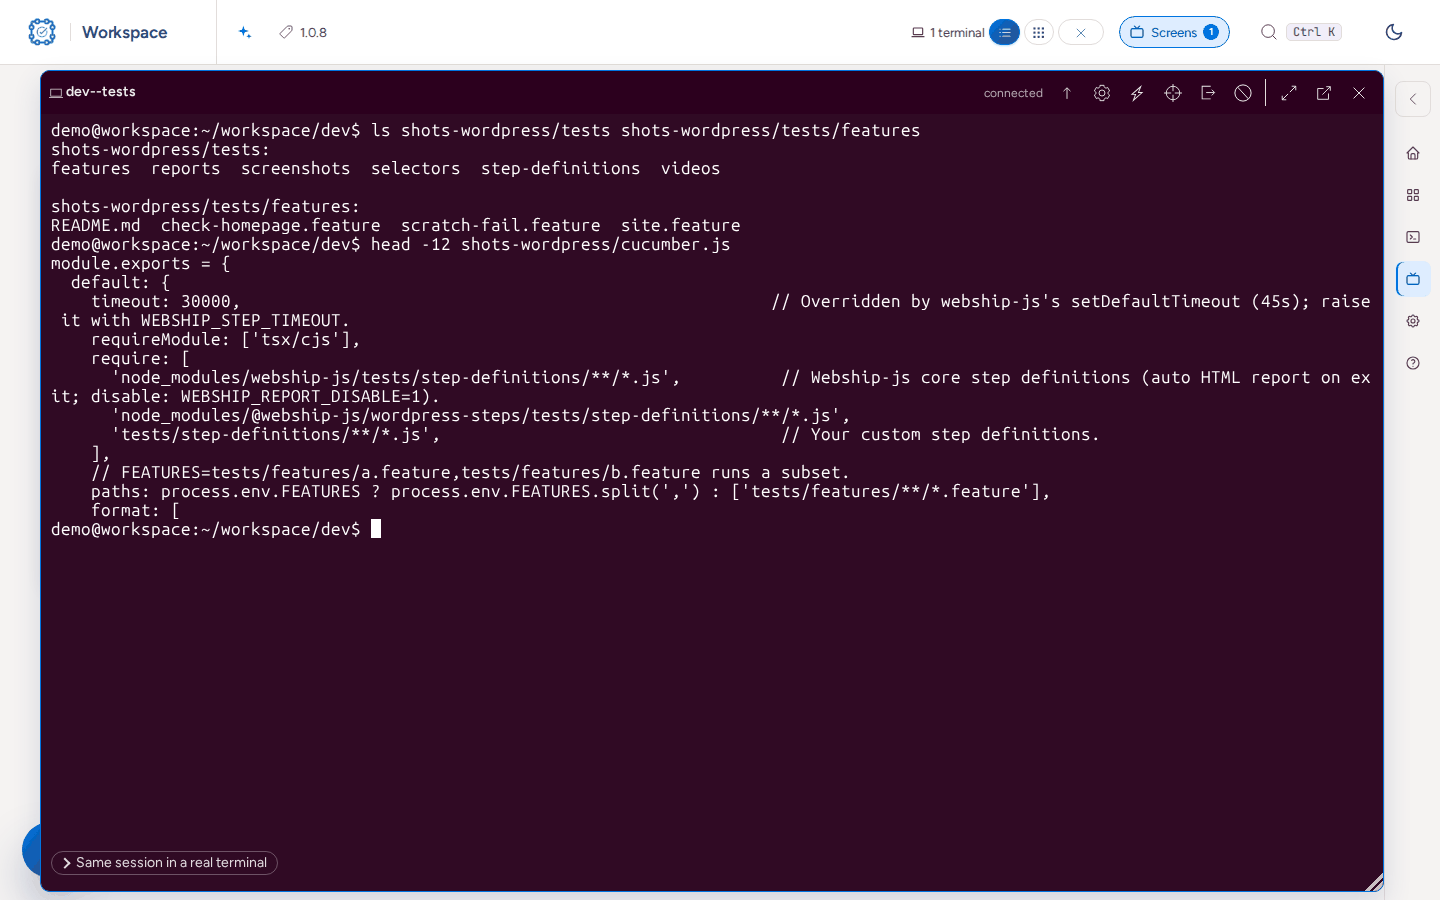
Read the first feature it gives, tests/features/site.feature: the front page, the login screen, each default account and its role.
cat shots-wordpress/tests/features/site.feature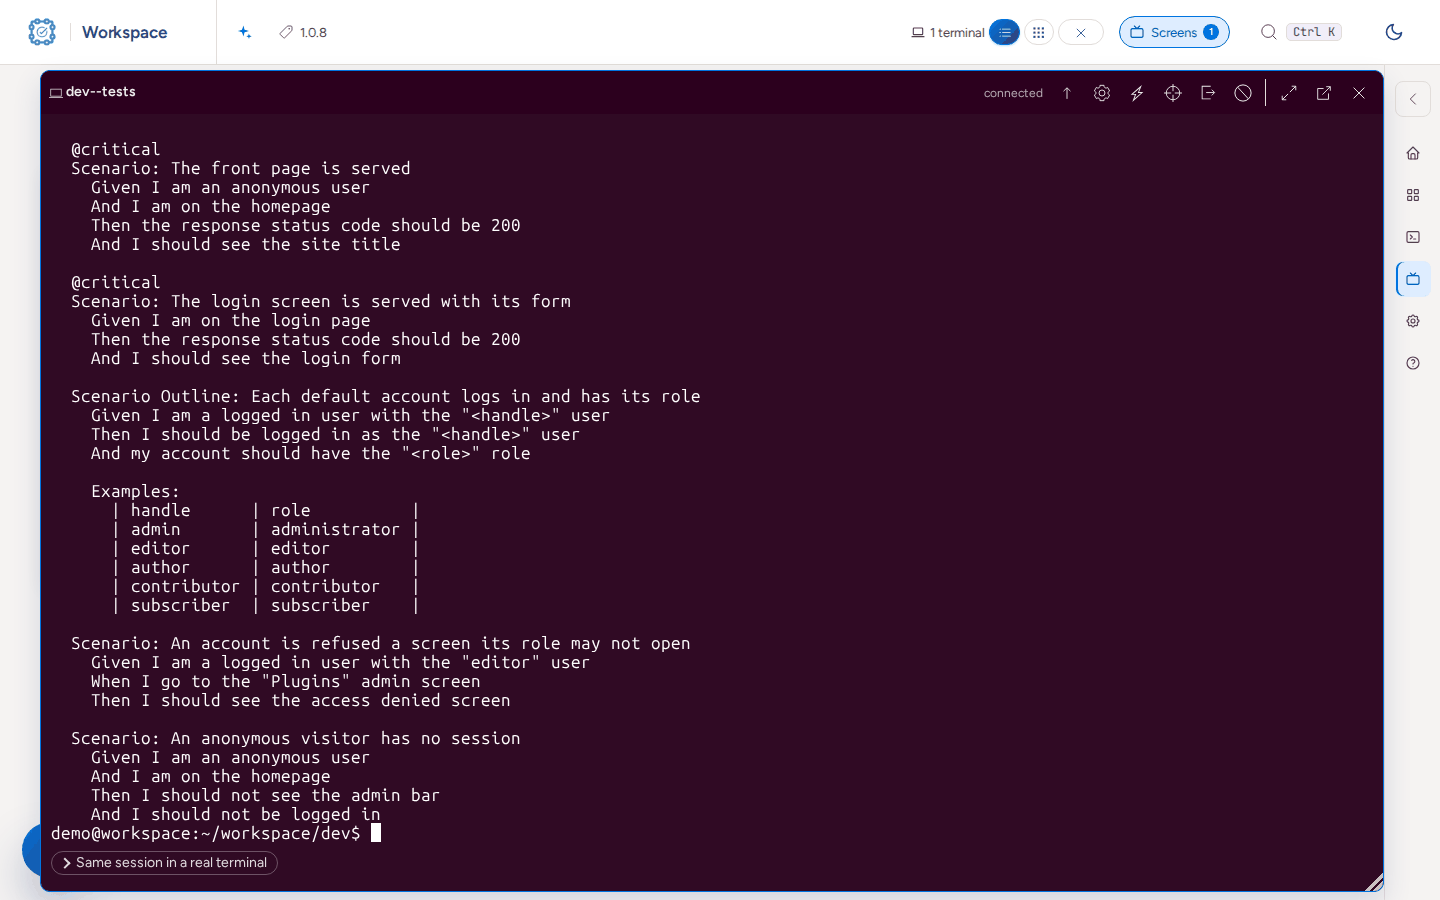
Run all: choose Run the tests in the Tests menu. The run starts as a screen session you can watch on Screens.
bash cmd-tools-testing.sh shots-wordpress --run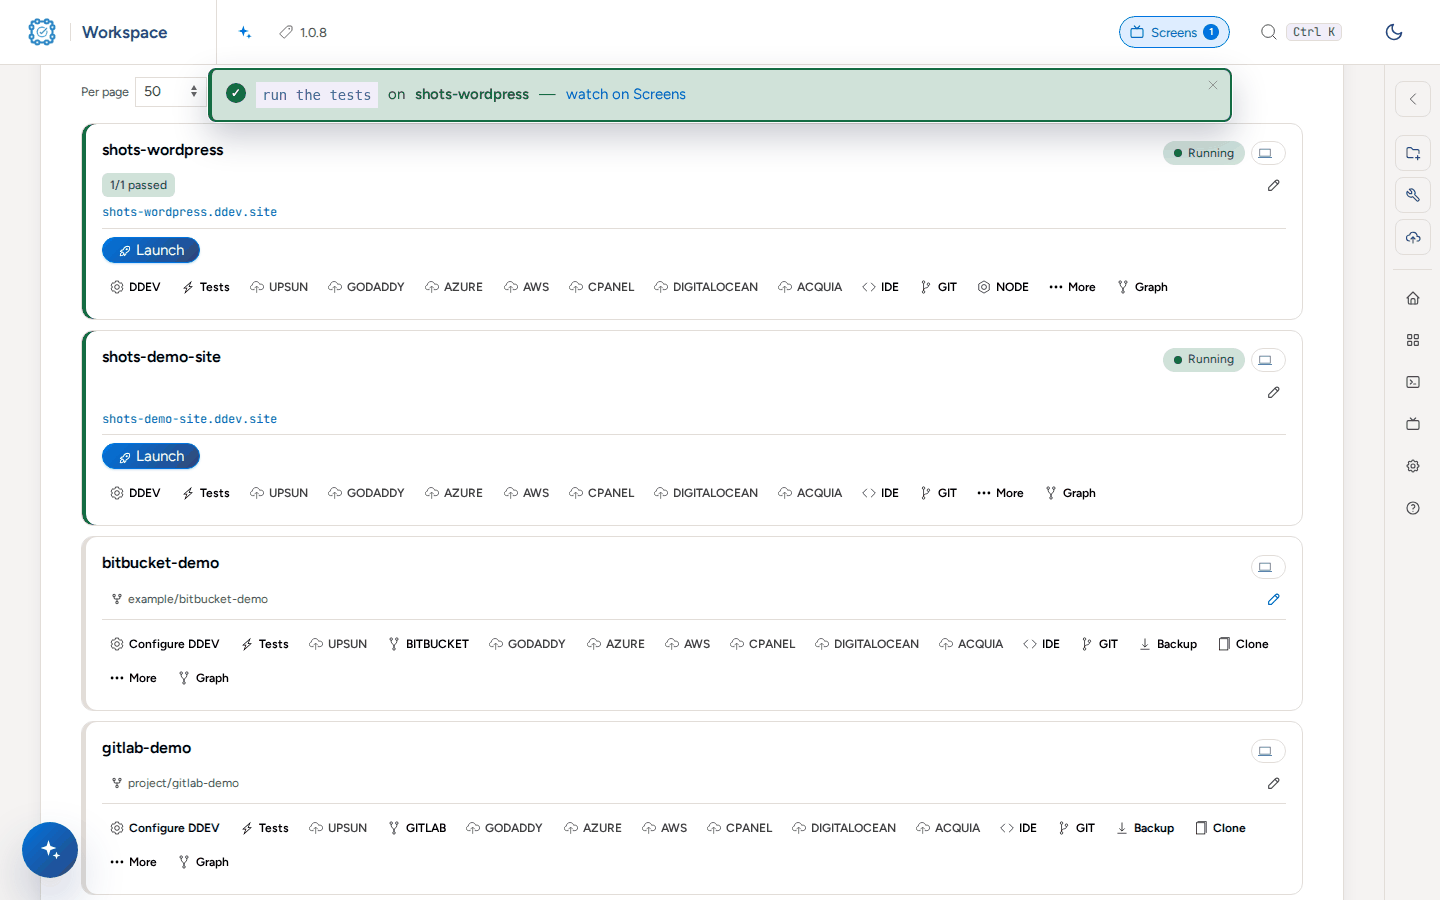
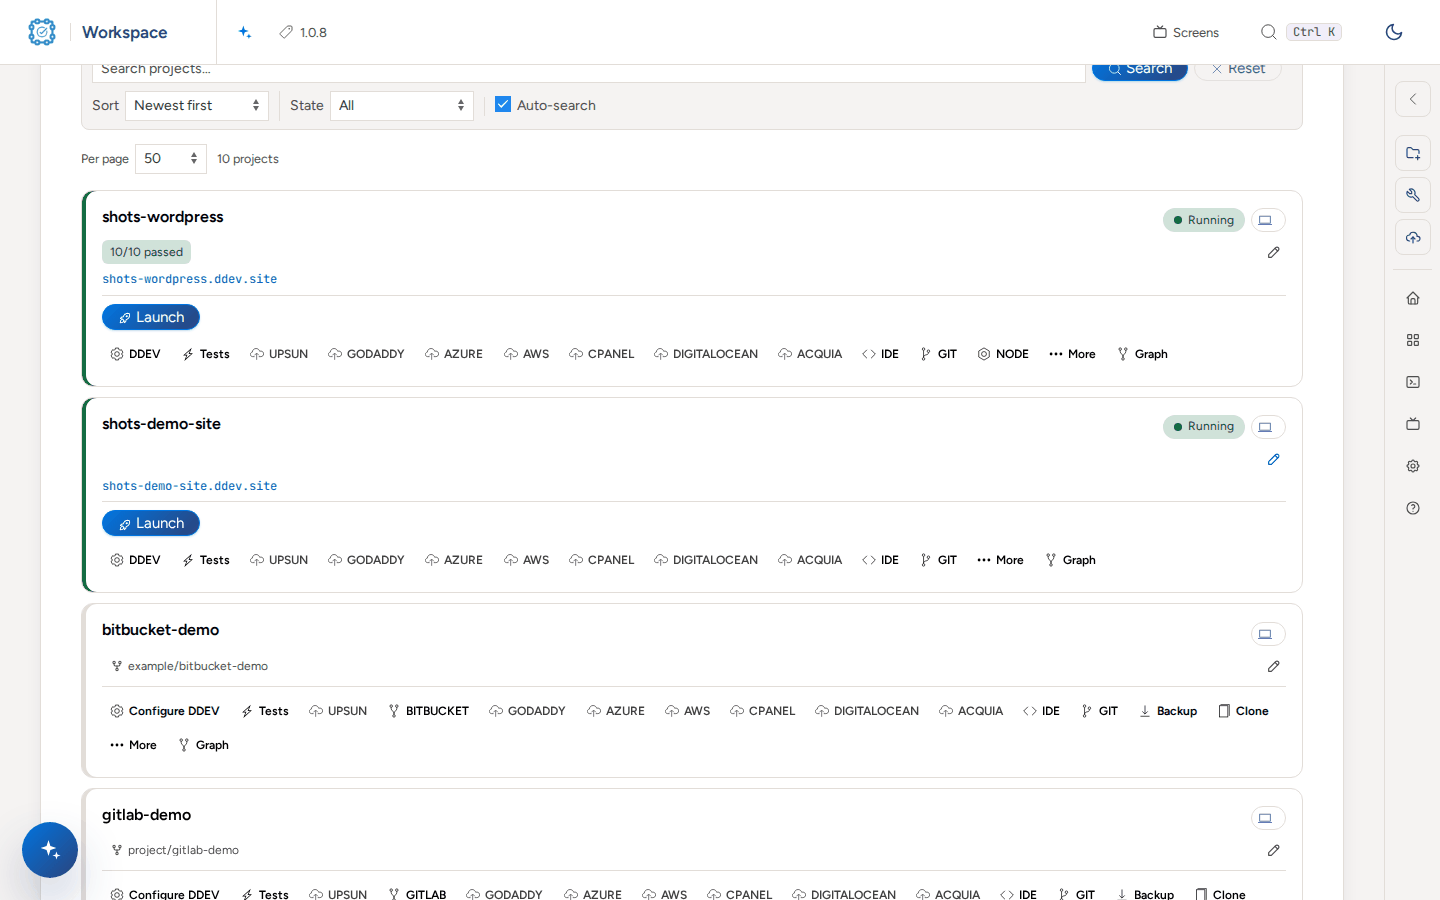
When it ends the project row shows the result, here 10/10 passed.
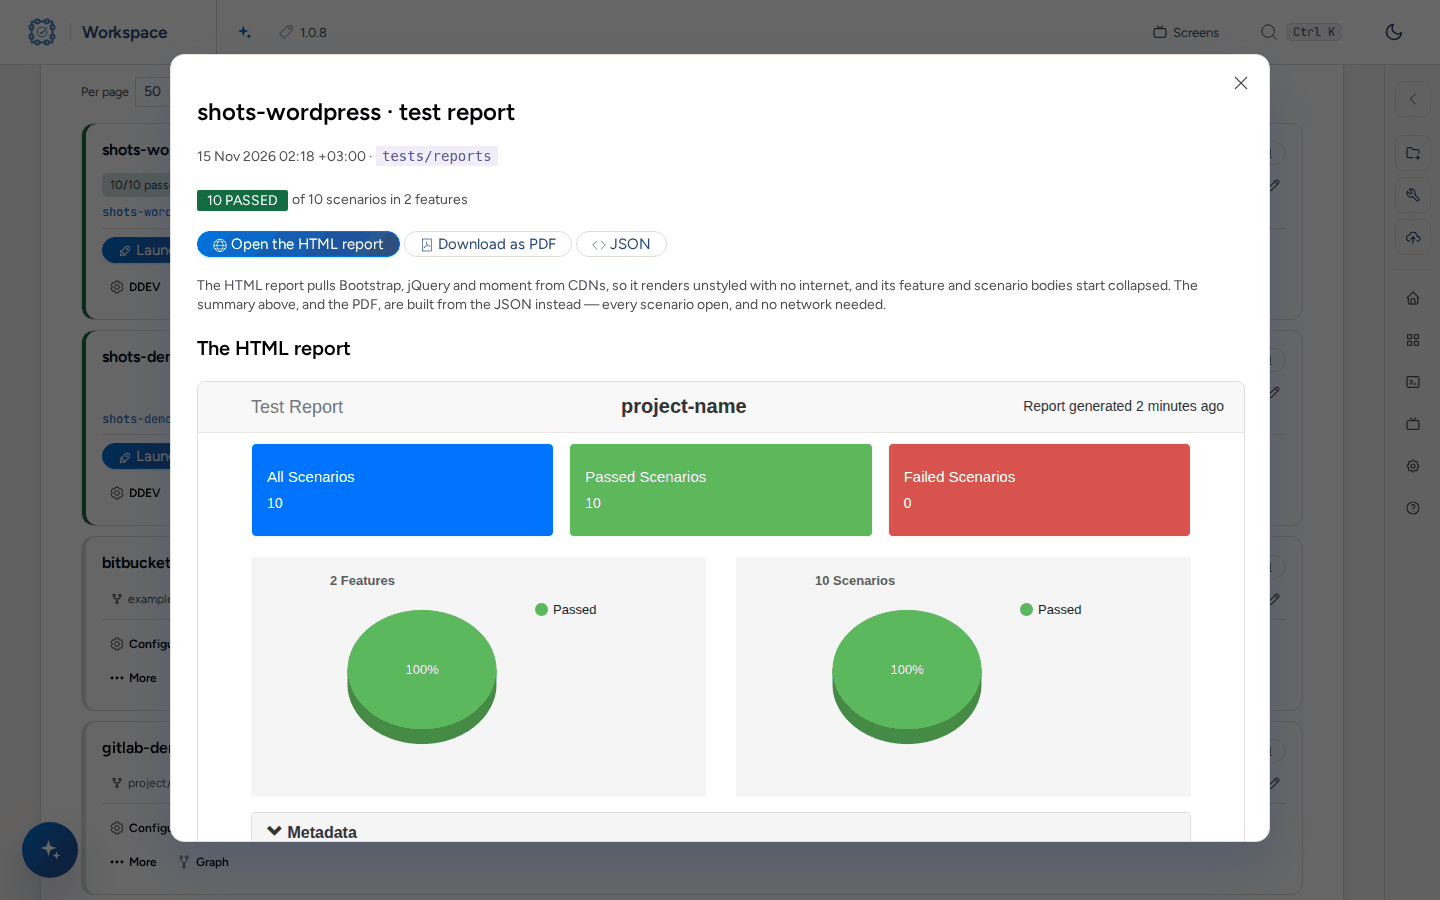
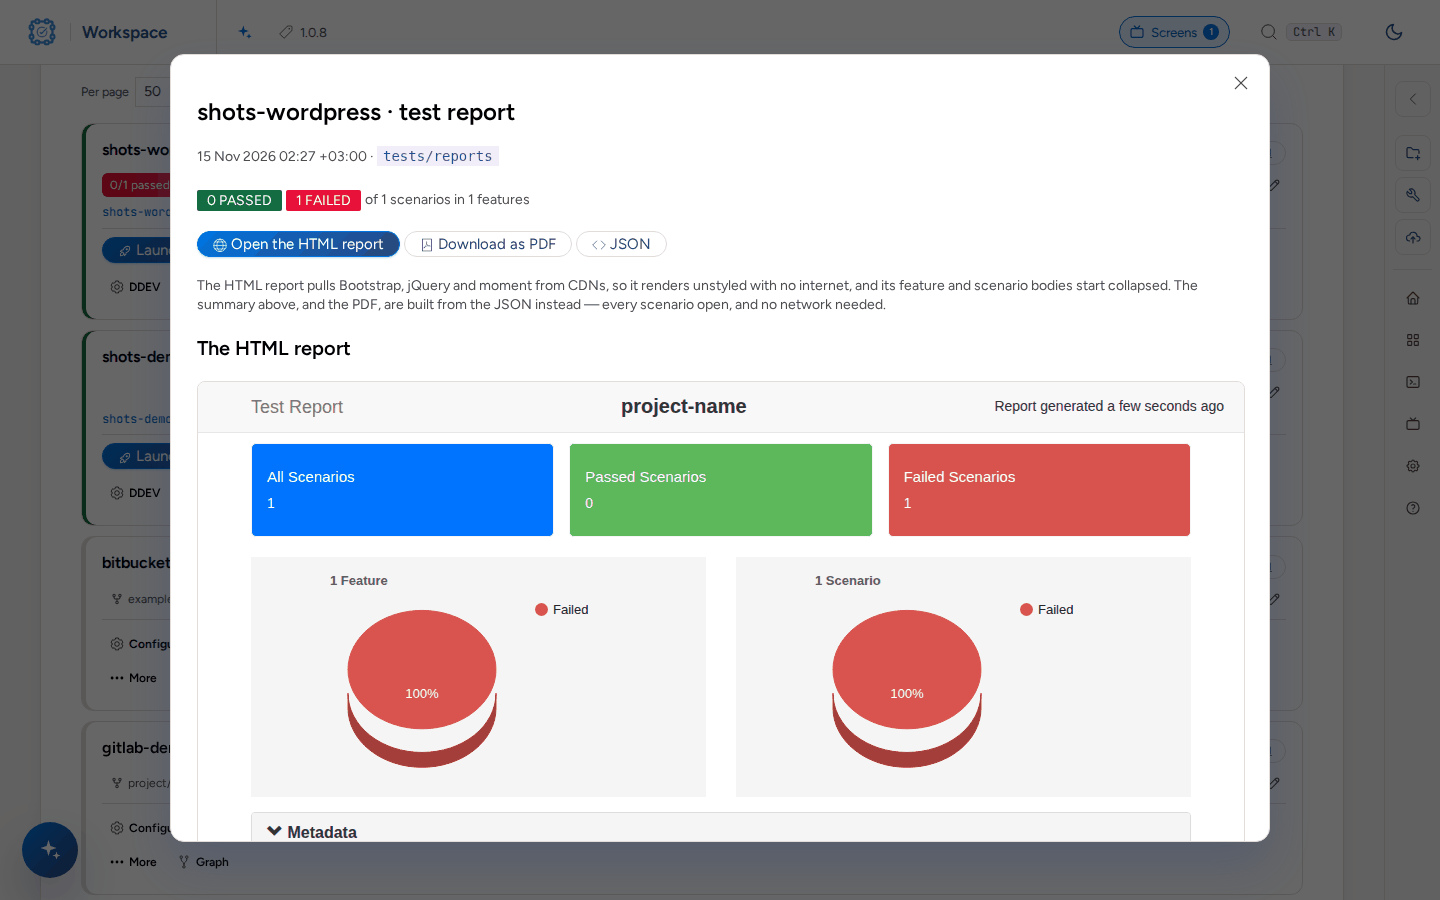
Open the report from the Tests menu: the totals, the HTML report, Download as PDF and JSON.
Run by tag from a terminal.
bash cmd-tools-testing.sh shots-wordpress --run --tags @critical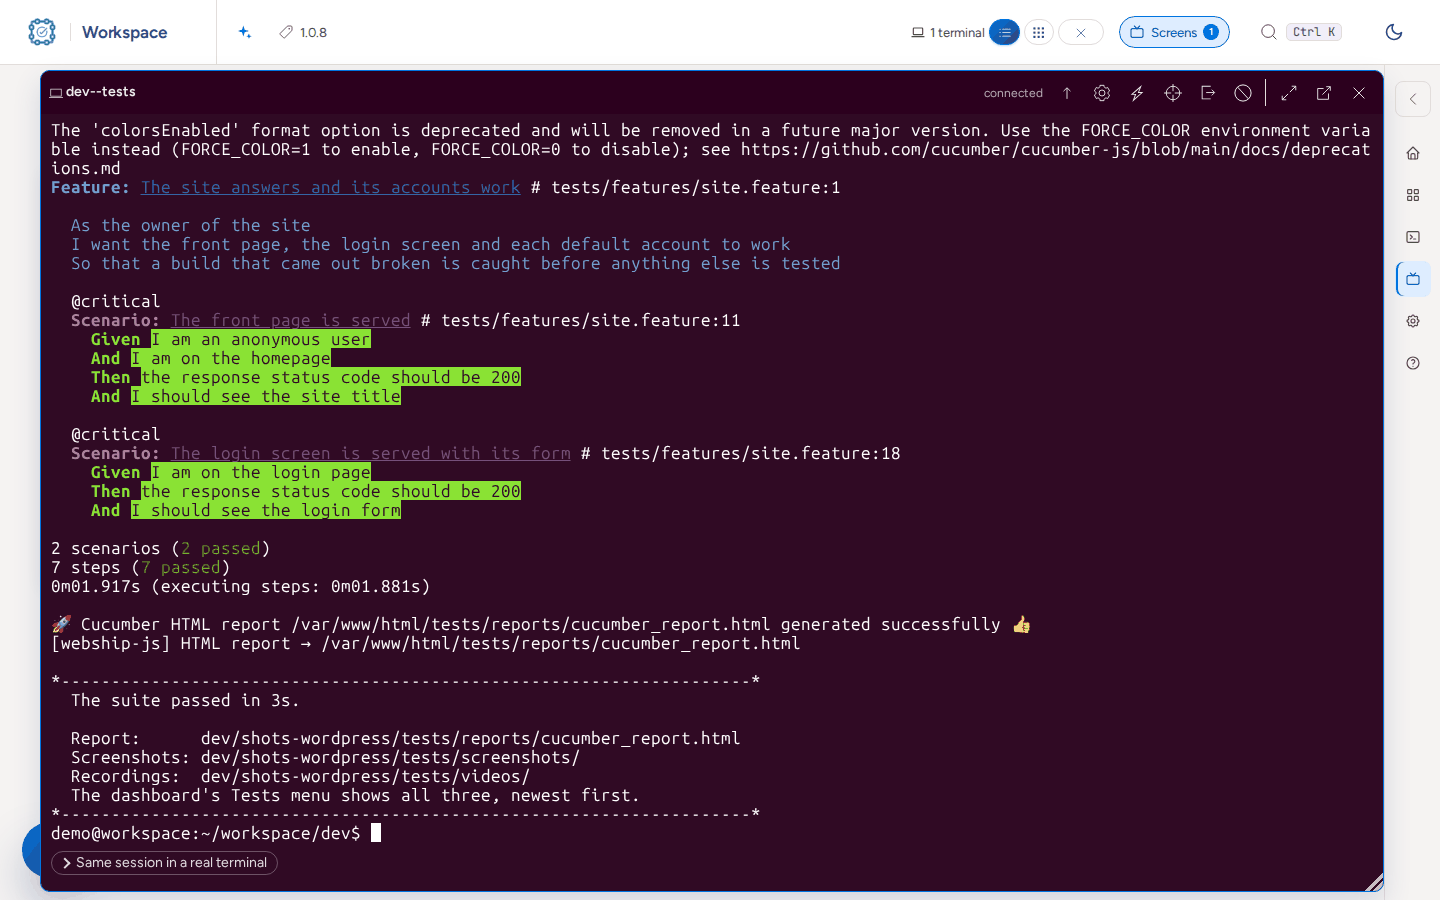
Run one feature by its path.
bash cmd-tools-testing.sh shots-wordpress --run --path tests/features/check-homepage.feature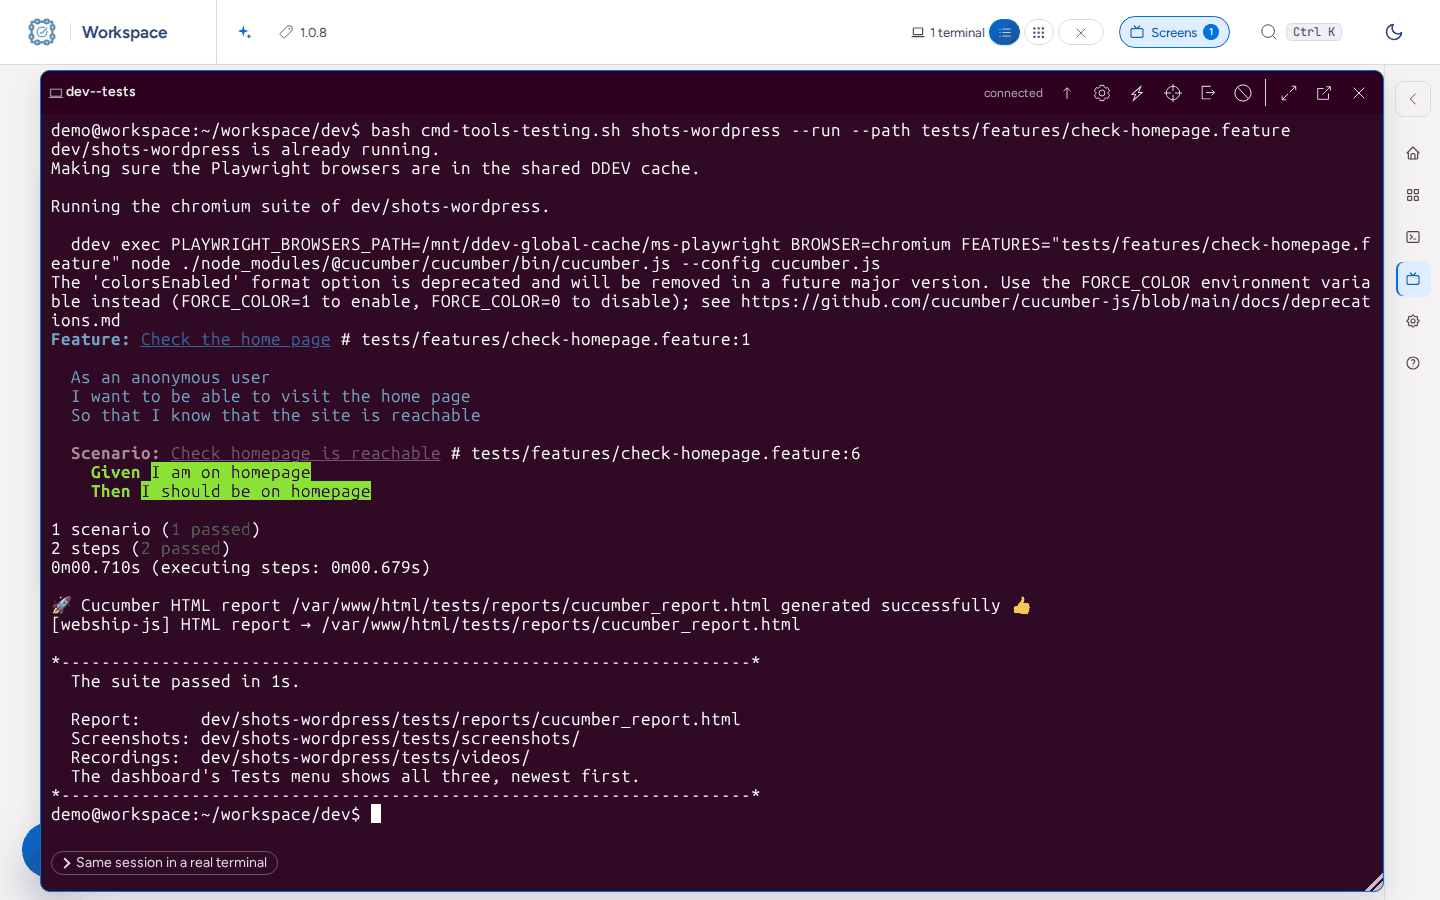
Do a dry run: every step is matched against the definitions and no browser opens.
bash cmd-tools-testing.sh shots-wordpress --dry-run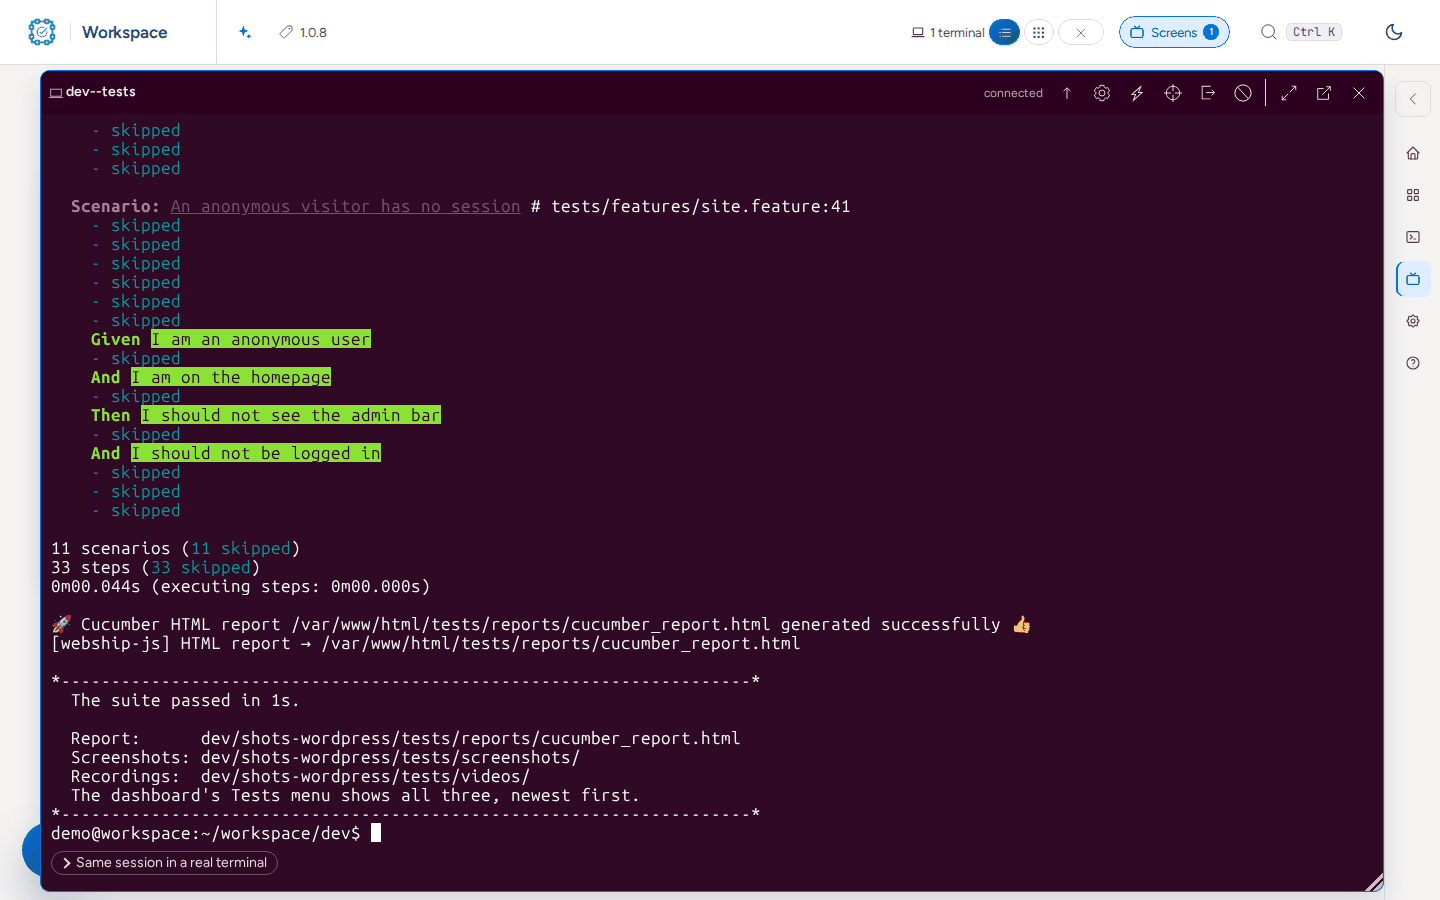
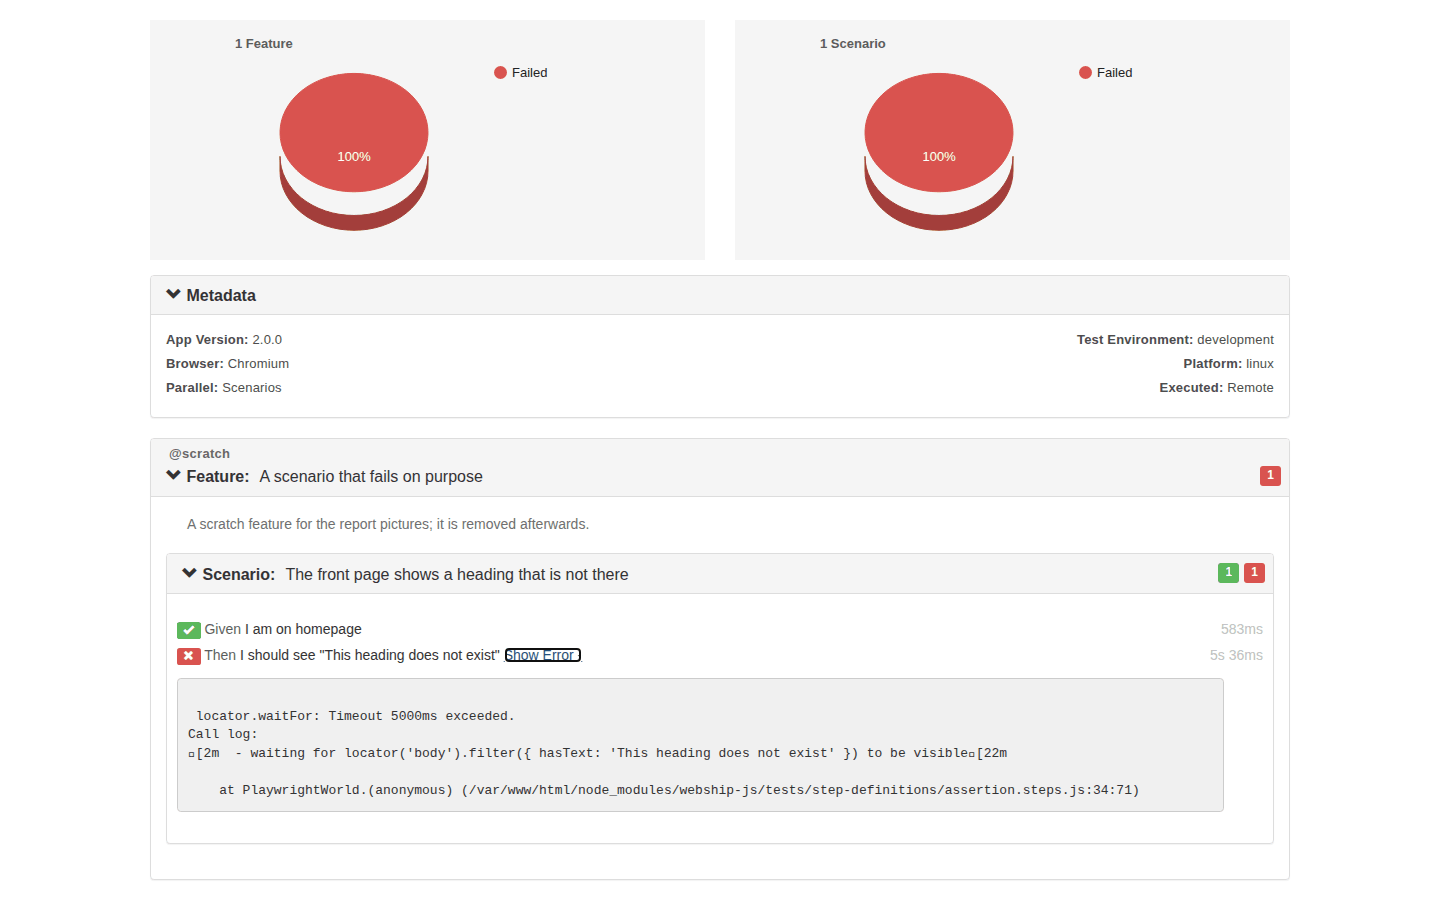
When a scenario fails the terminal shows the step and the error.
bash cmd-tools-testing.sh shots-wordpress --run --path tests/features/scratch-fail.feature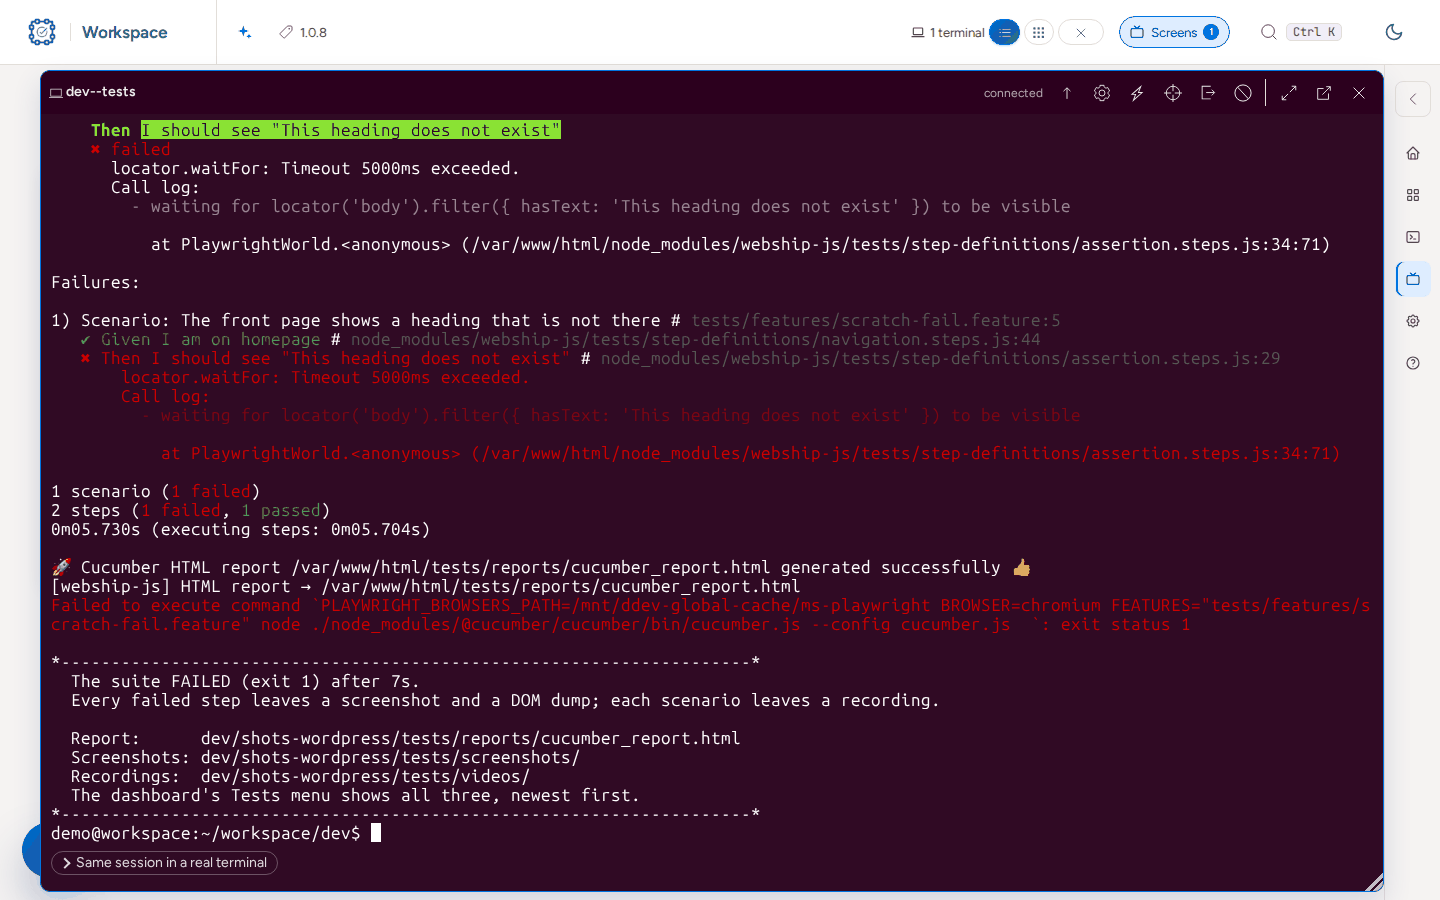
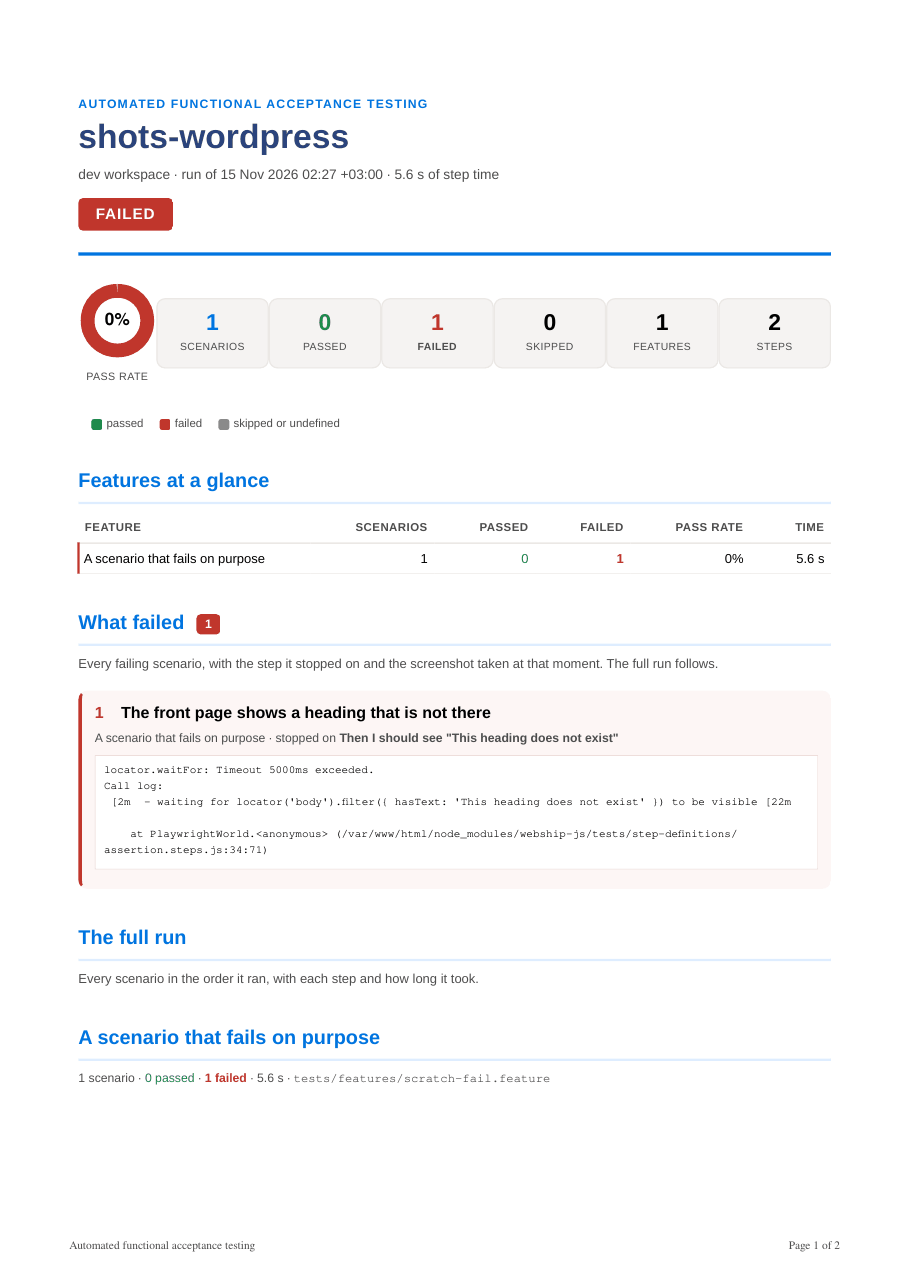
The row badge turns red, and the report in the dashboard counts the failure.
Open the HTML report, the feature, the scenario and Show Error to read the failed step.
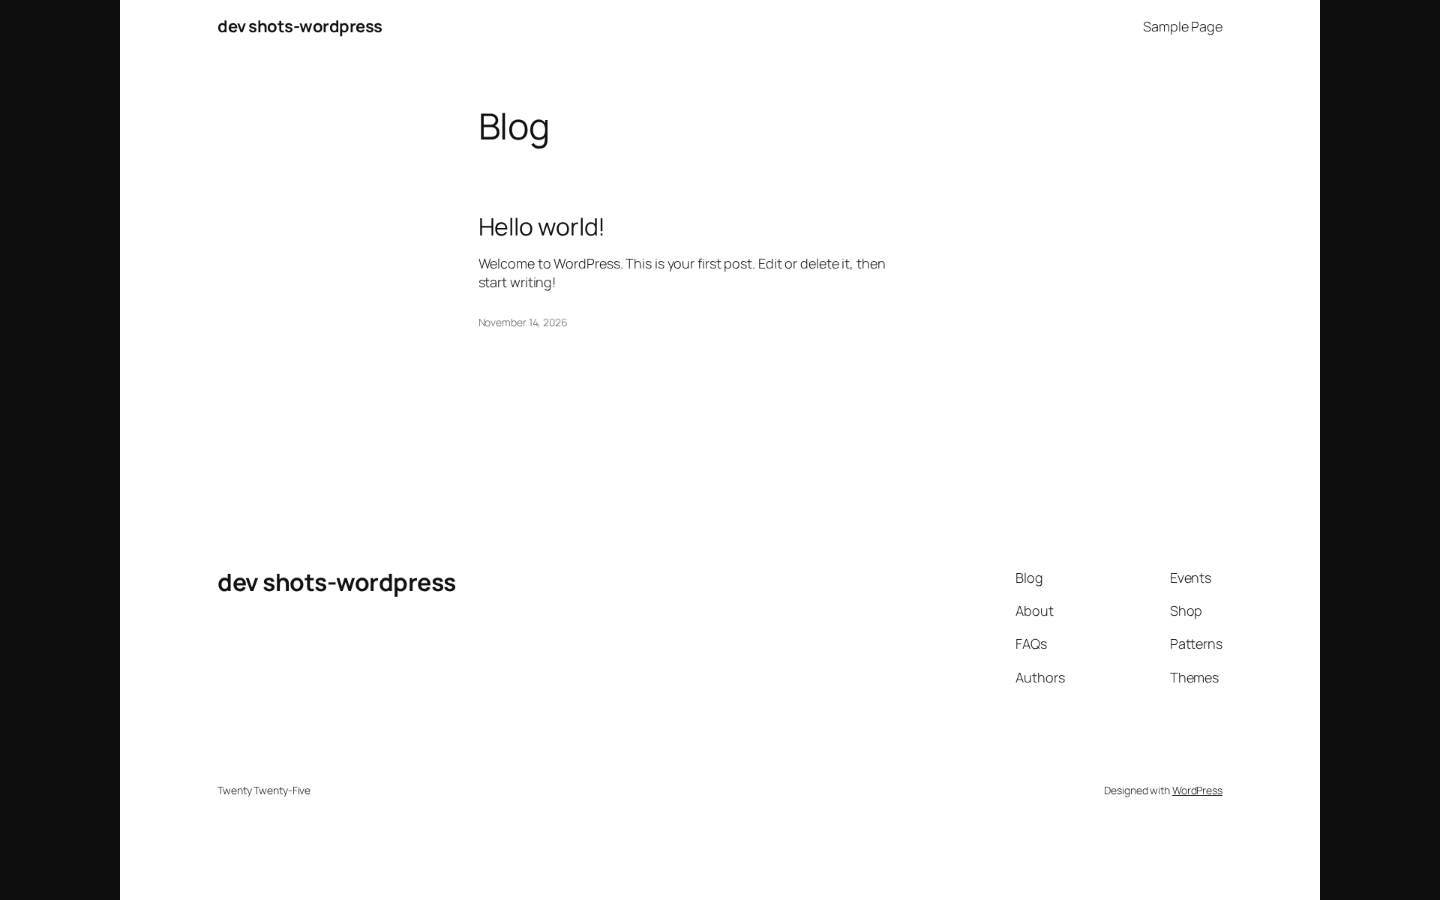
Open the failure screenshot in tests/screenshots.
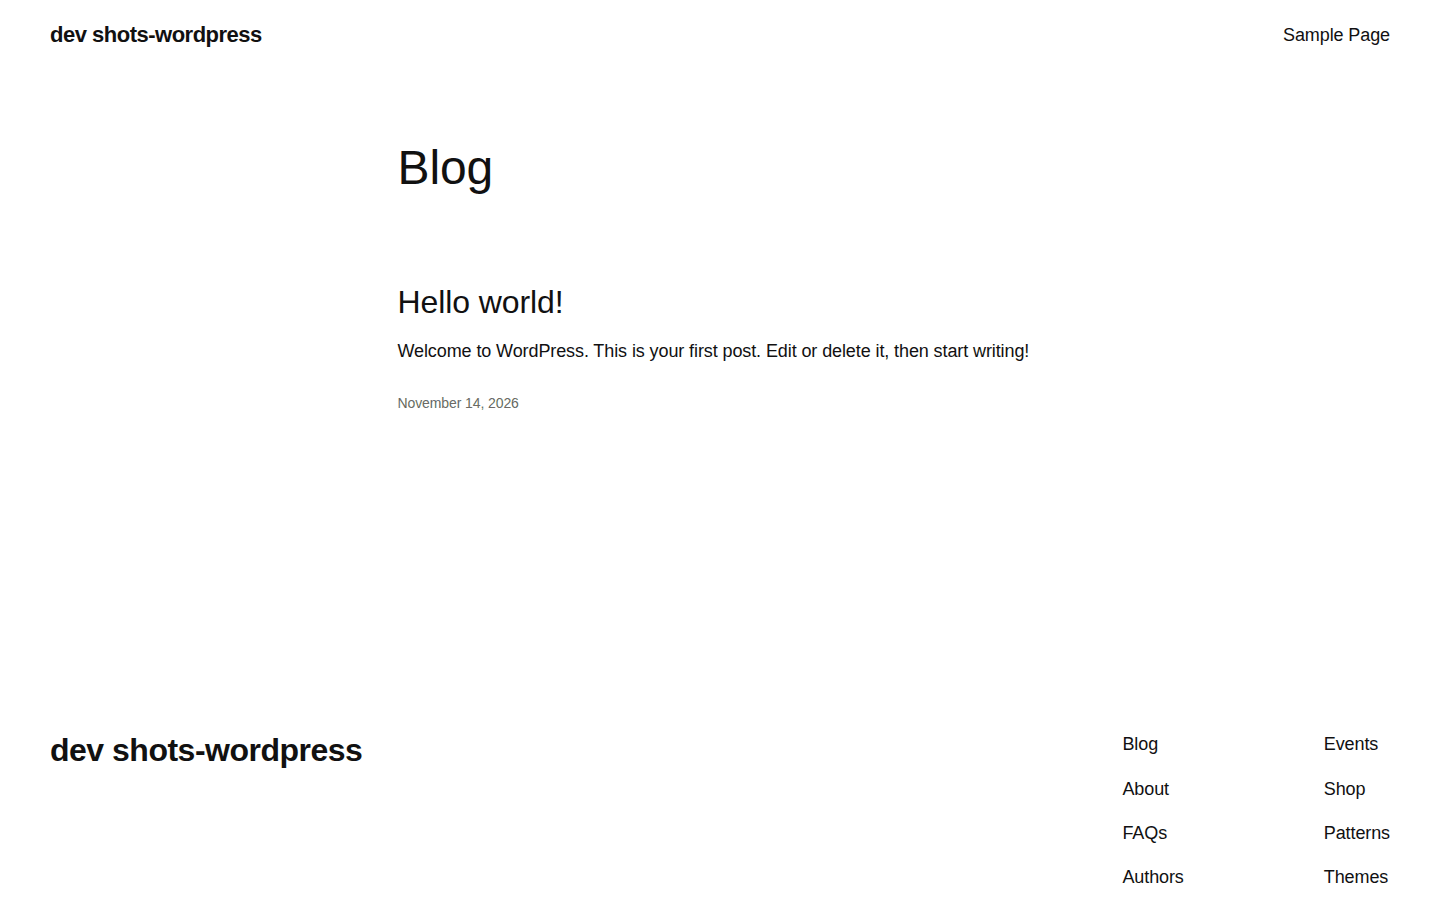
Open the DOM dump saved beside it.
To record, set video: { mode: 'on', dir: 'tests/videos' } in worldParameters of cucumber.js and run again. Each scenario leaves a .webm.
bash cmd-tools-testing.sh shots-wordpress --run --path tests/features/check-homepage.feature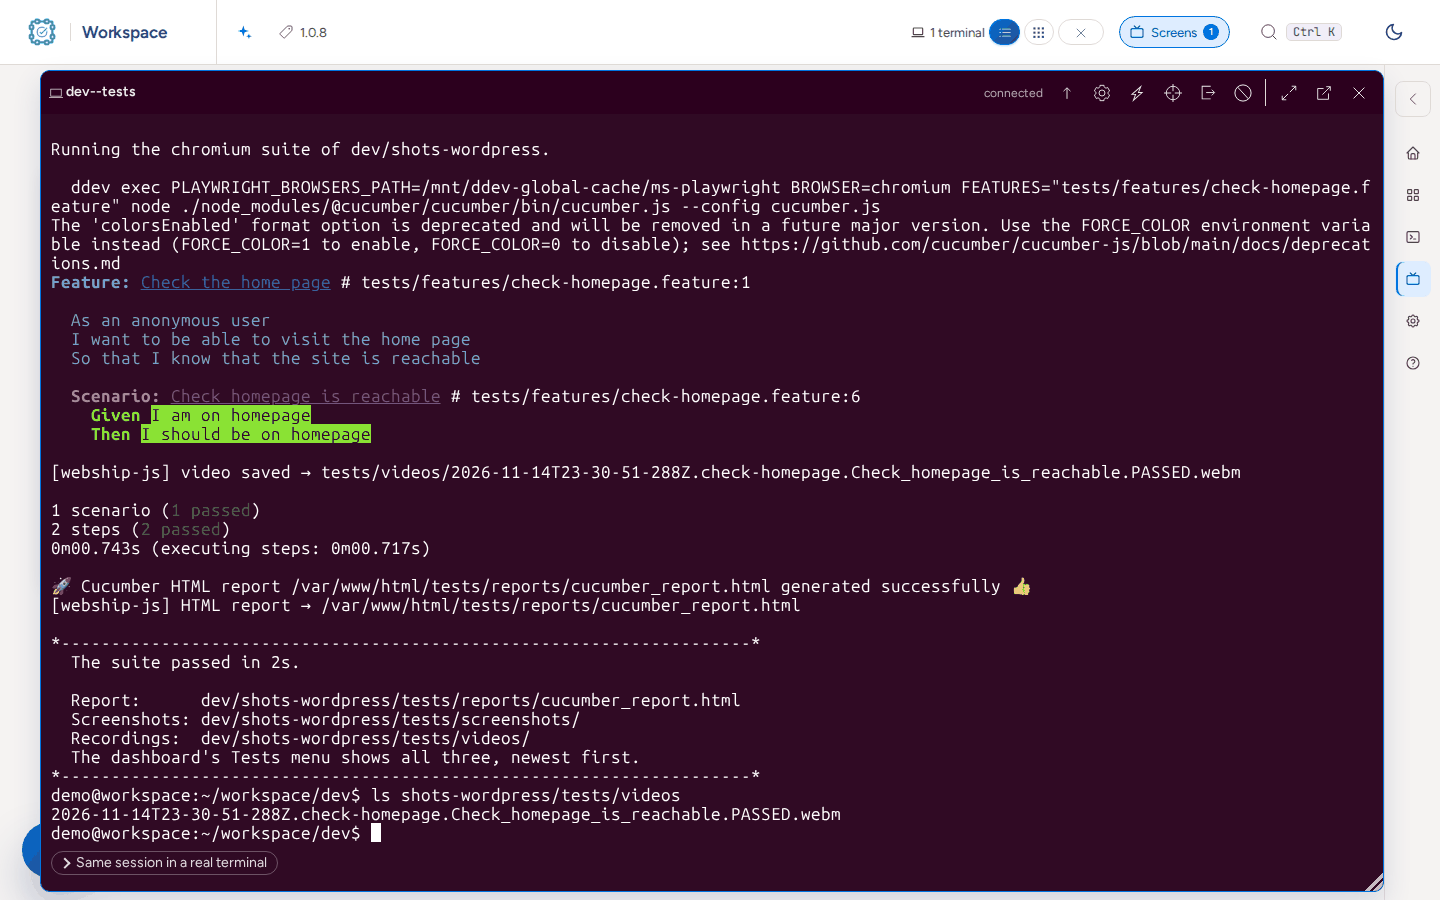
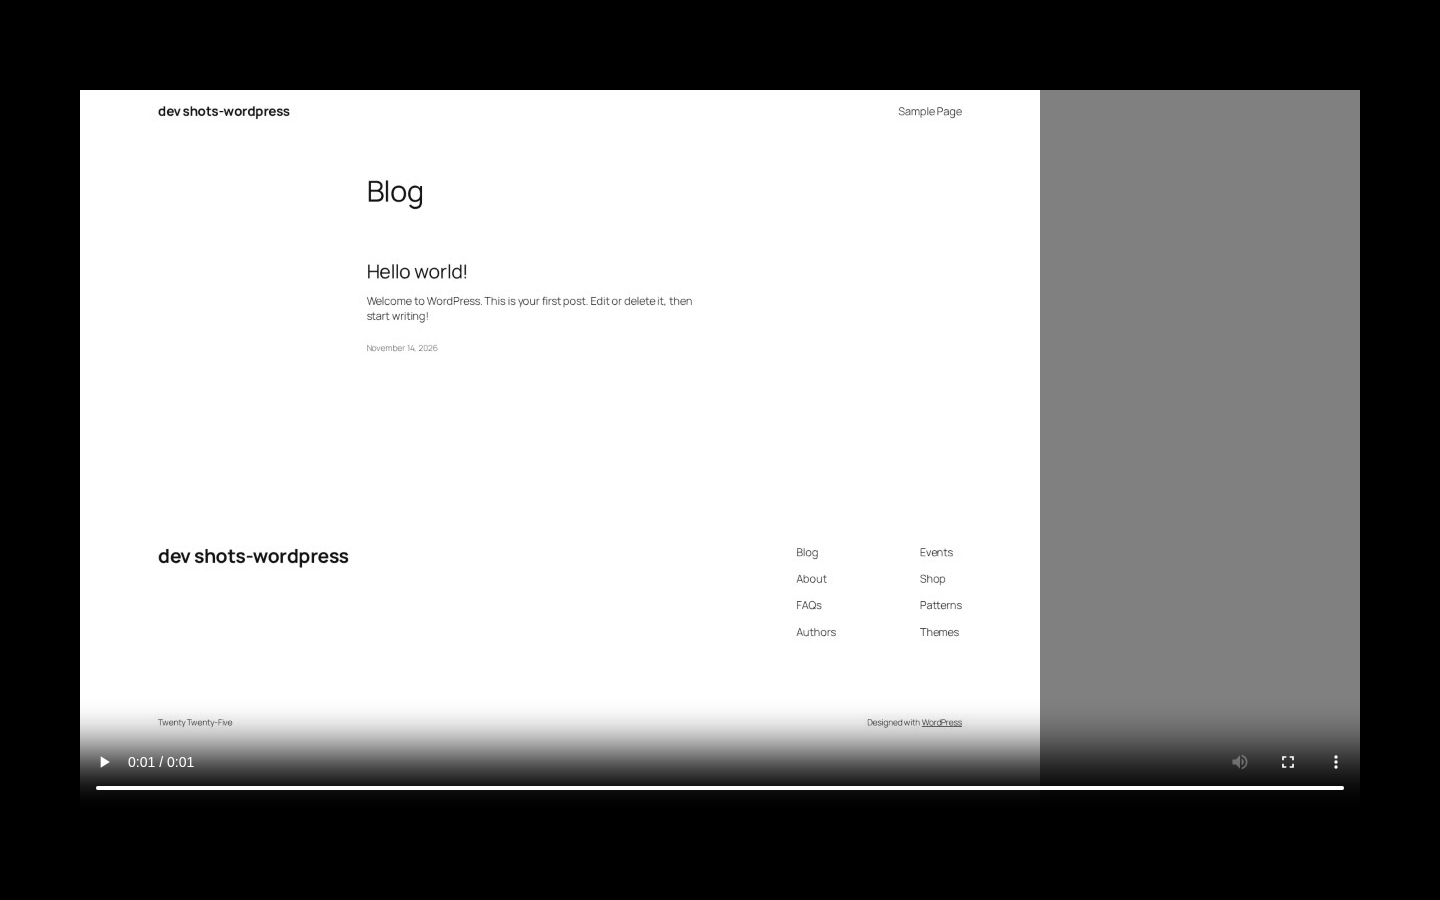
Open the recording.
Press Download as PDF in the report for the same run as a document.
Watch a long run on Screens
Open Screens in the header. Each running session is listed with its log and Open terminal.
Press Follow the log to read the output while it runs.
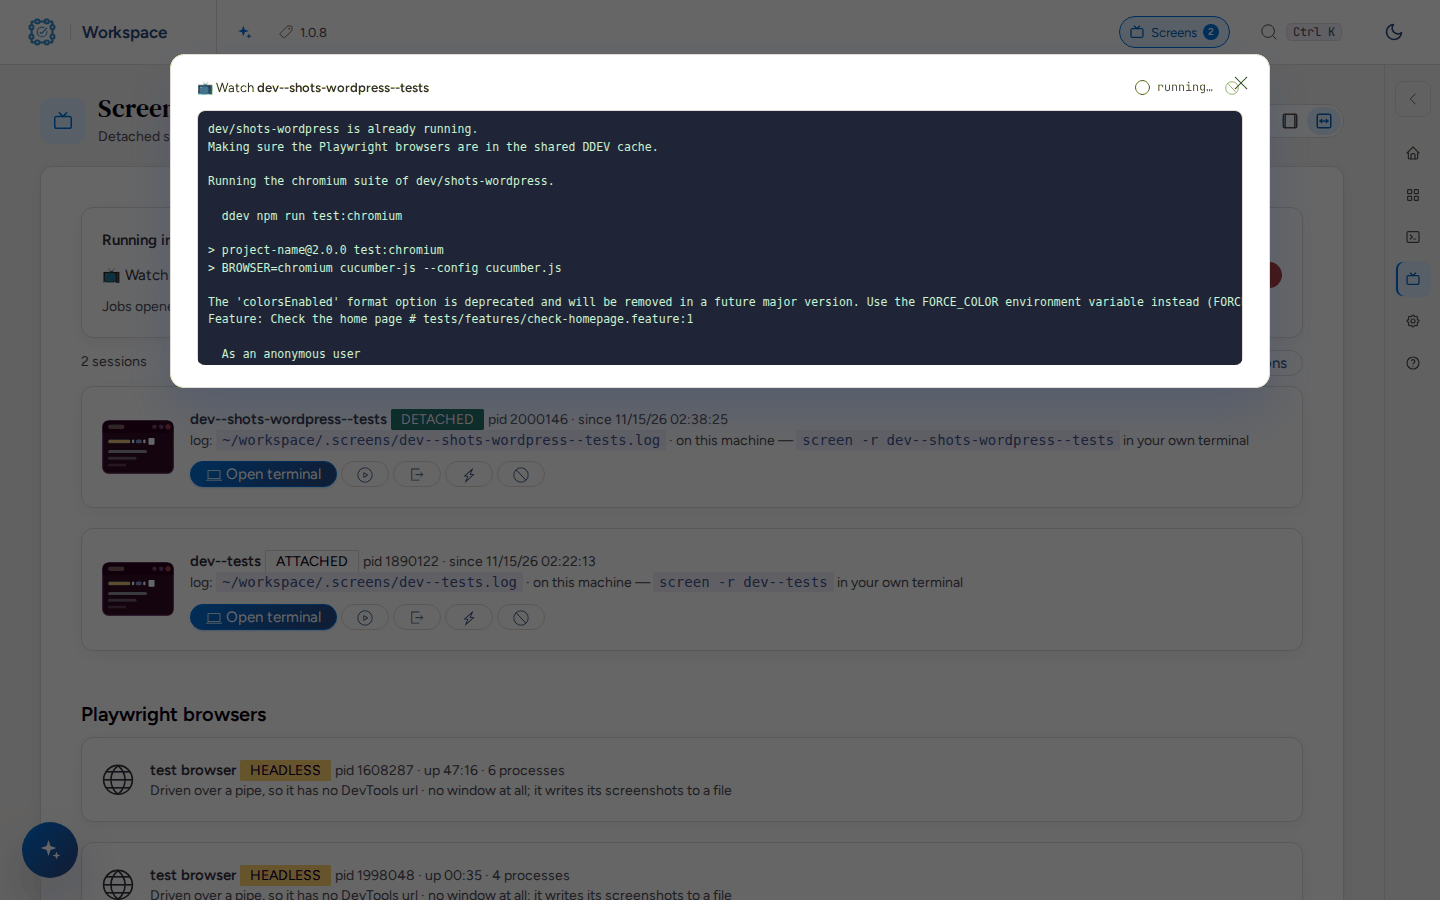
Press Open terminal to work in the session from the browser.