Walkthroughs in pictures

The dashboard step by step, in pictures taken on a demo workspace: finding your way around, adding a plugin, testing a project with Webship-js and watching a long run. Every plugin page has its own steps under "In pictures".

Add a Webship Workspace plugin from Settings → Plugins

  1. Open Settings → Plugins. Each plugin has a card with its four steps: required, activated, installed, configured.
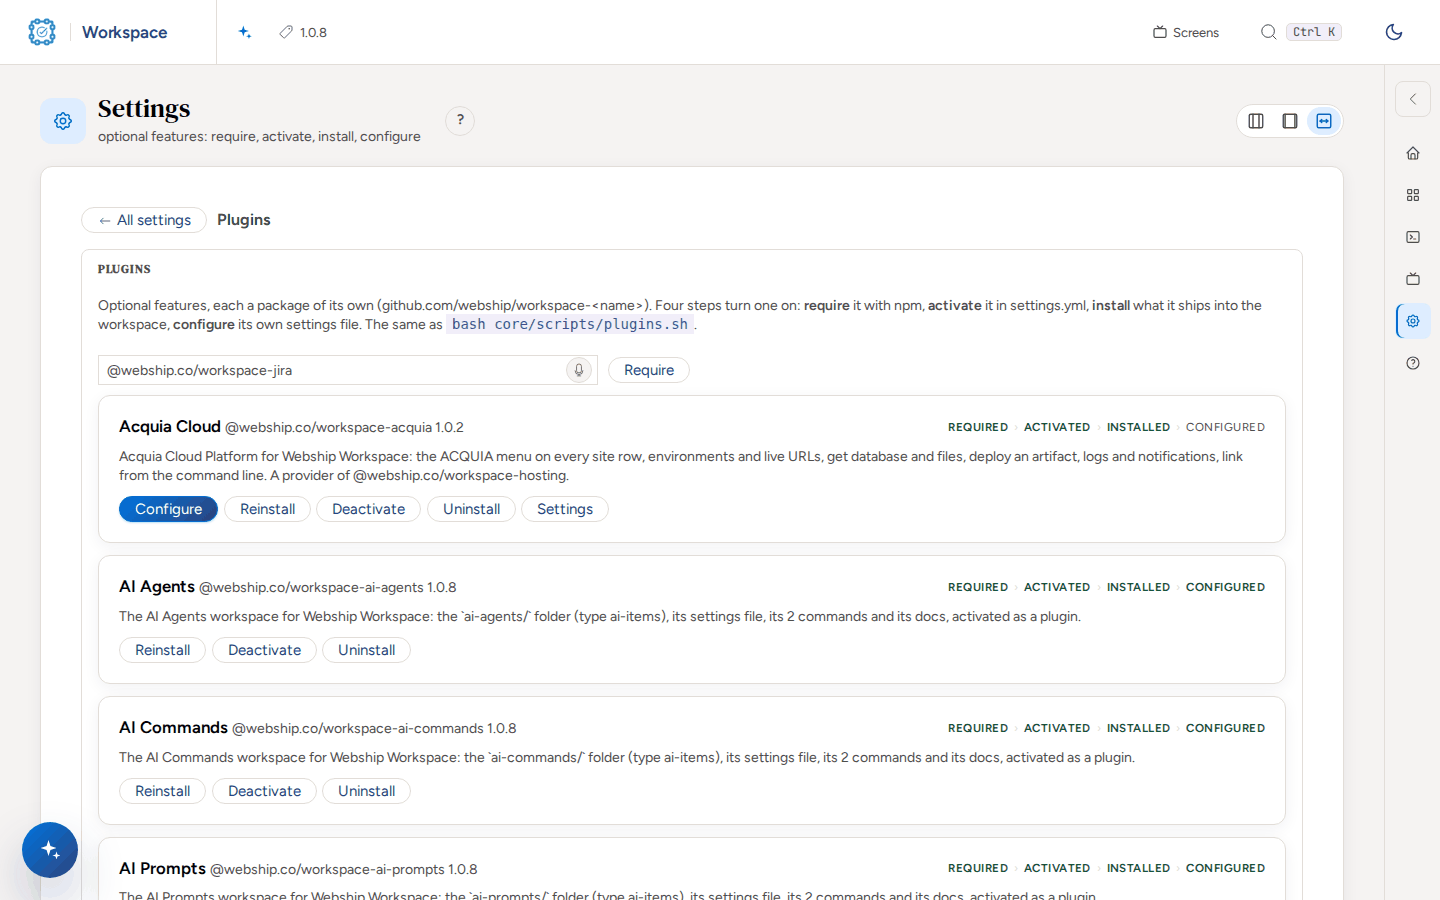
    The Plugins page: a field to require a package, and a card per plugin with its four steps (required, activated, installed, configured) and its buttons.

  2. Scroll to the catalogue and press Require beside the plugin you want. You see the npm install in a terminal panel and "Required".

    bash core/scripts/plugins.sh --require @webship.co/workspace-jira
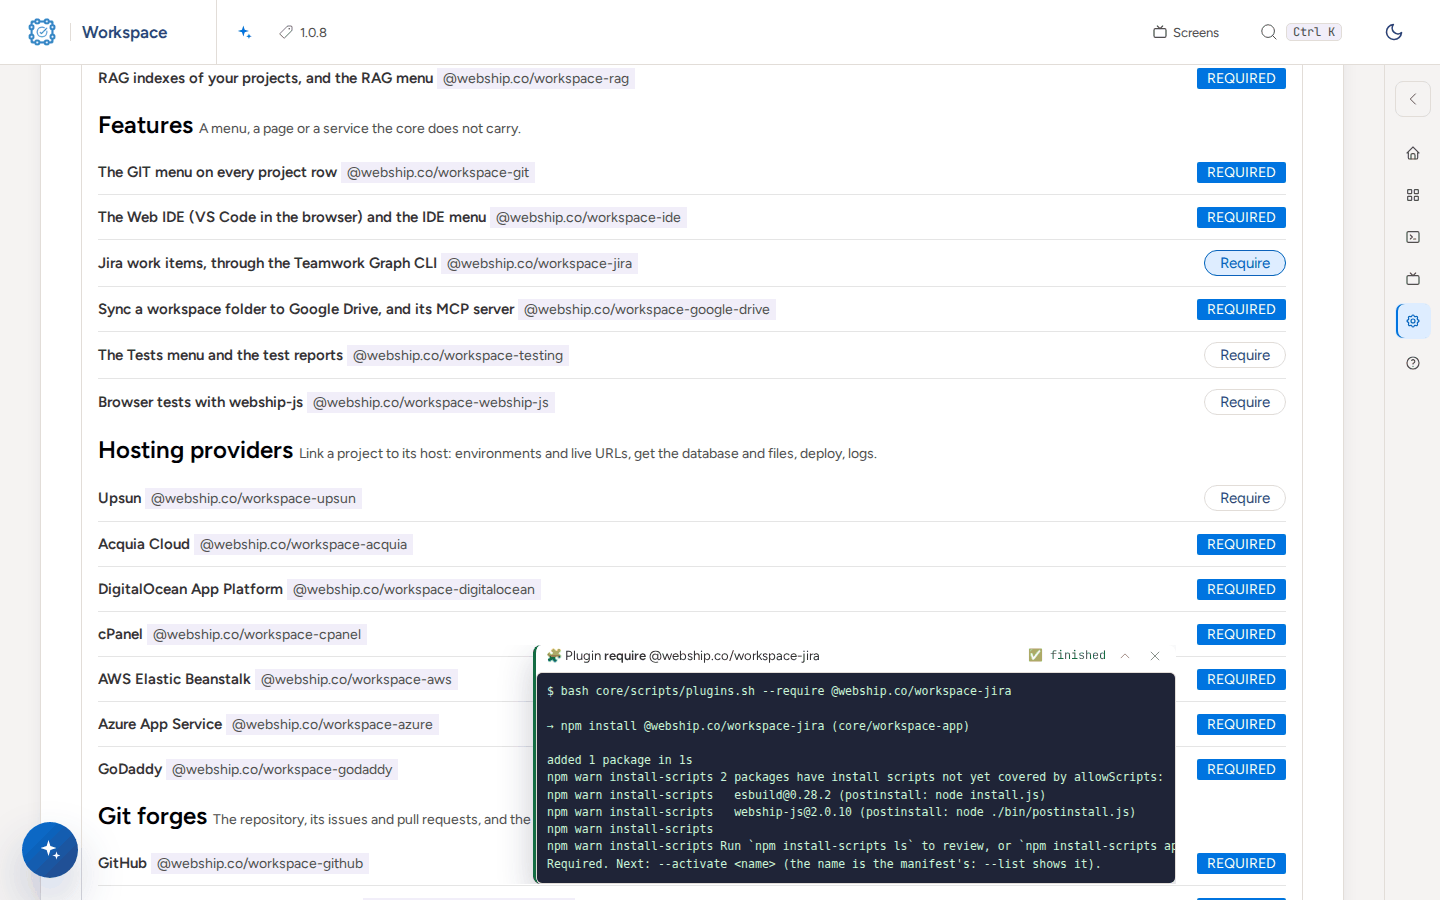
    After pressing Require for Jira, a terminal panel shows bash core/scripts/plugins.sh --require @webship.co/workspace-jira, the npm install and the line Required. Next: --activate.

  3. Reload the page and press Activate on the new card. The plugin is switched on in settings.yml.

    bash core/scripts/plugins.sh --activate jira
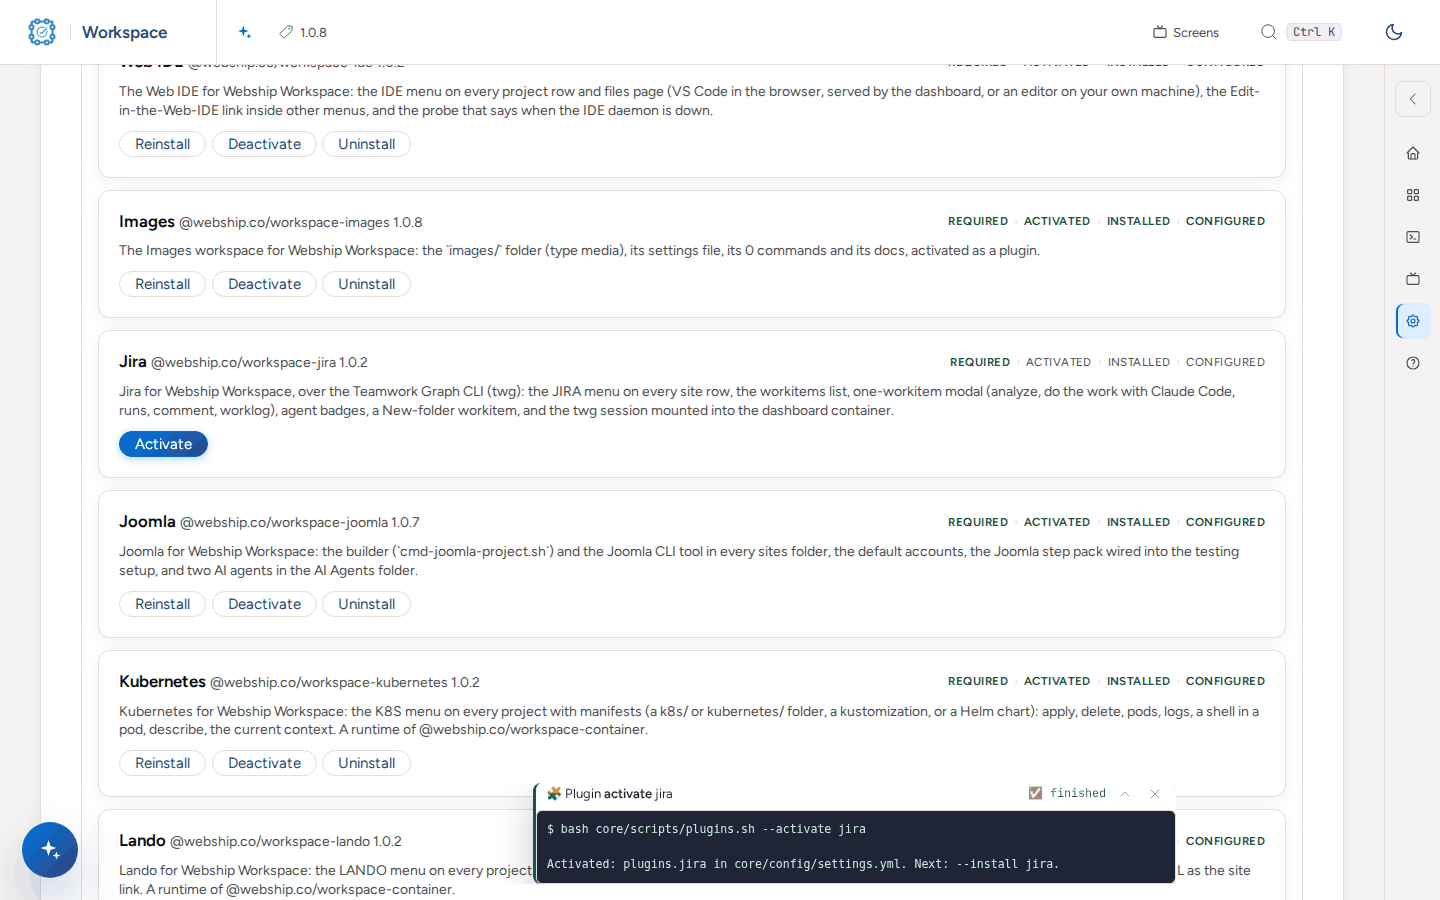
    After pressing Activate, the terminal panel shows plugins.sh --activate jira and the line Activated: plugins.jira in core/config/settings.yml.

  4. Press Install. The plugin places its files and says what the host still needs.

    bash core/scripts/plugins.sh --install jira
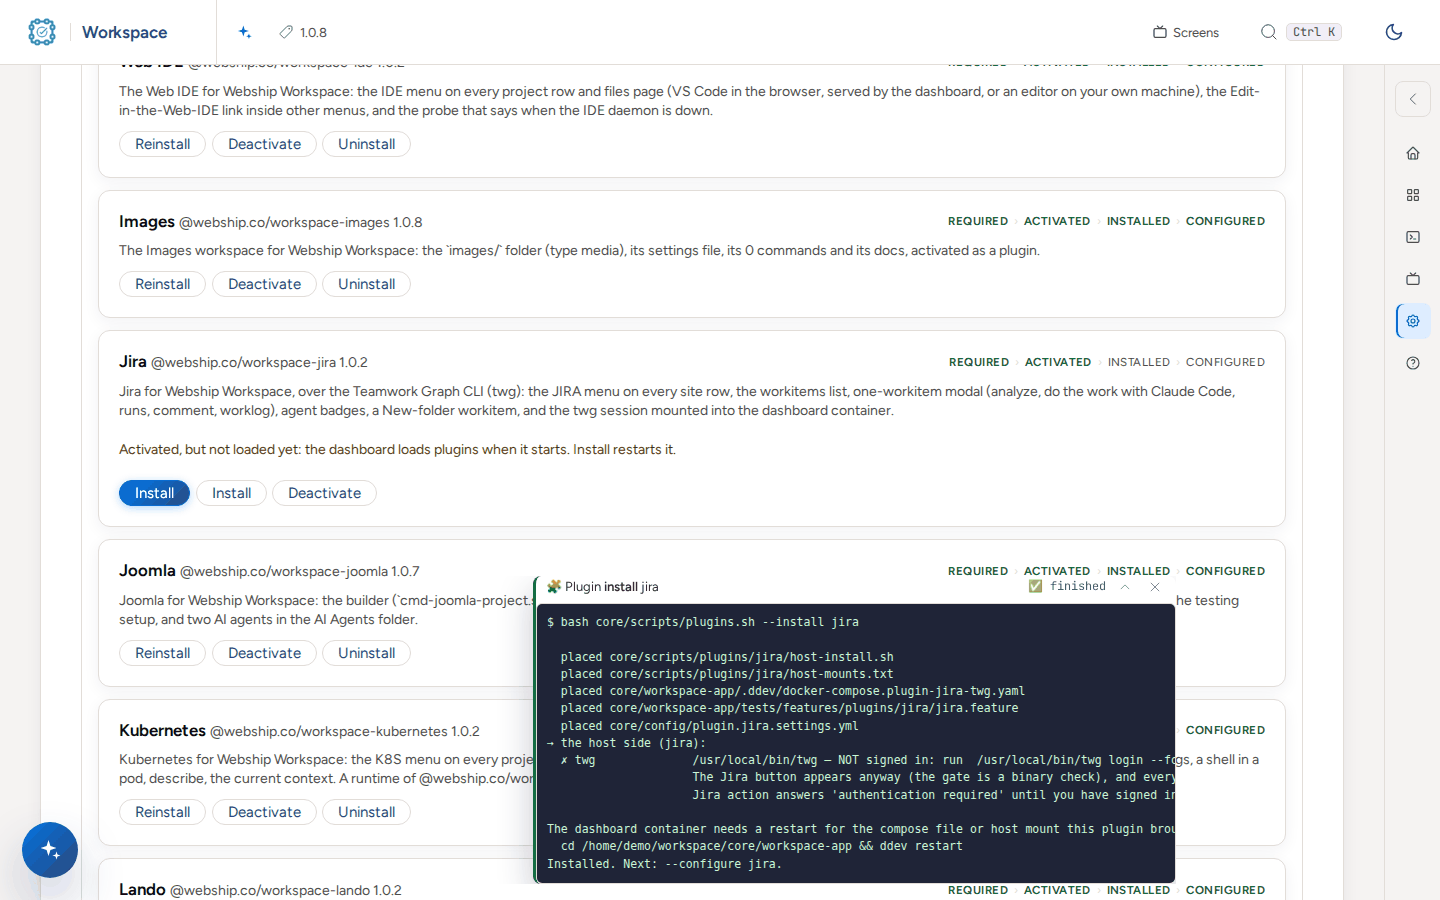
    After pressing Install, the terminal panel lists the files the Jira plugin placed, the host-side check of the twg command, and the line Installed. Next: --configure jira.

  5. Restart the dashboard so it loads the plugin. The card then shows Settings.
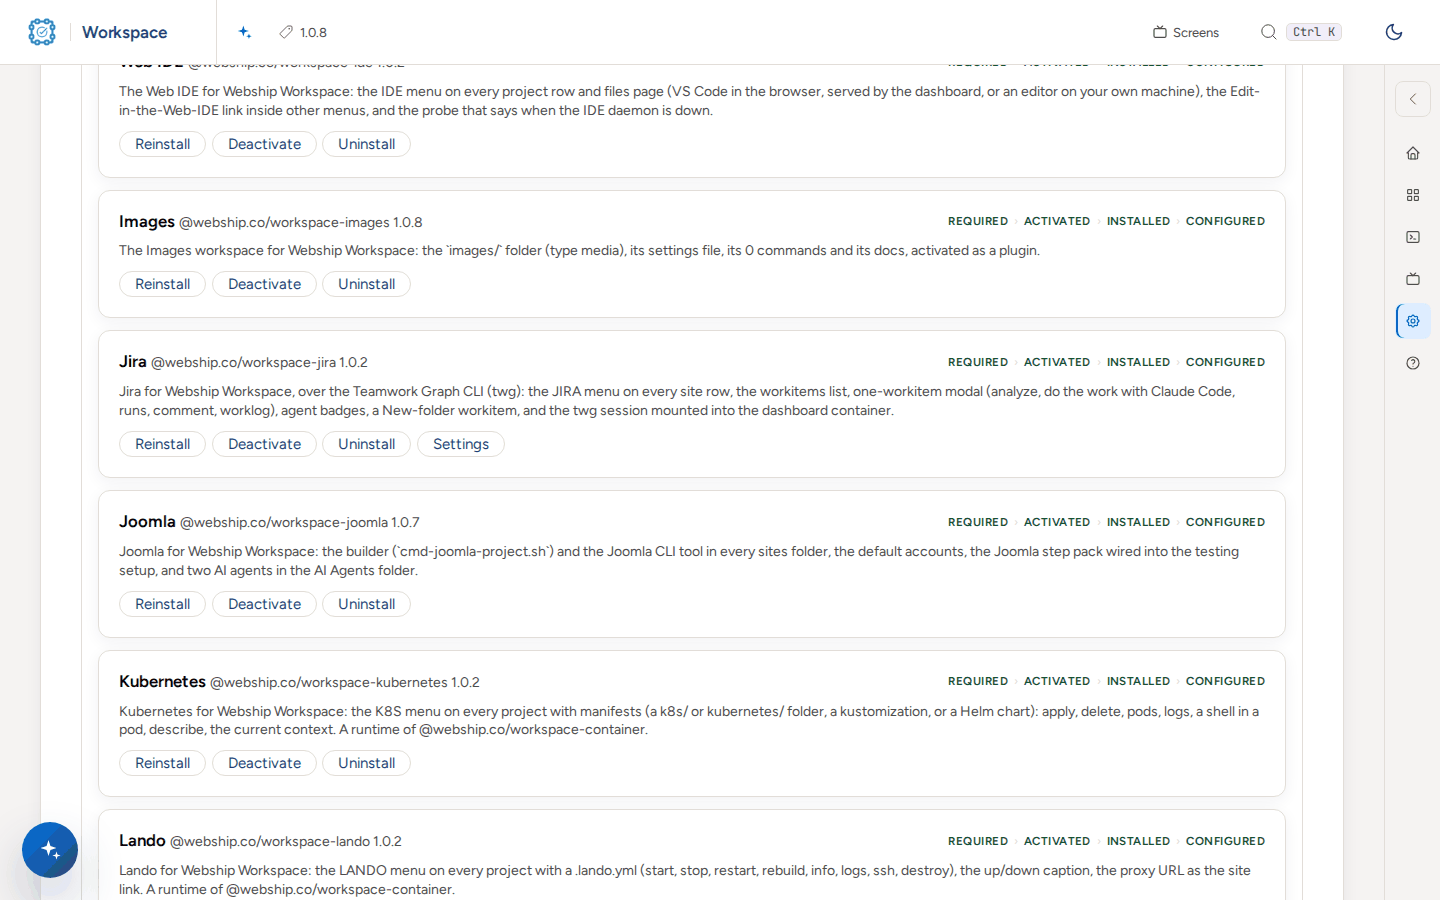
    The Jira card with its steps marked and the buttons Reinstall, Deactivate, Uninstall and Settings.

  6. Open the plugin's own settings file and fill it. A plugin with a settings file stays at "next: configure" until then.

    bash core/scripts/plugins.sh --configure jira
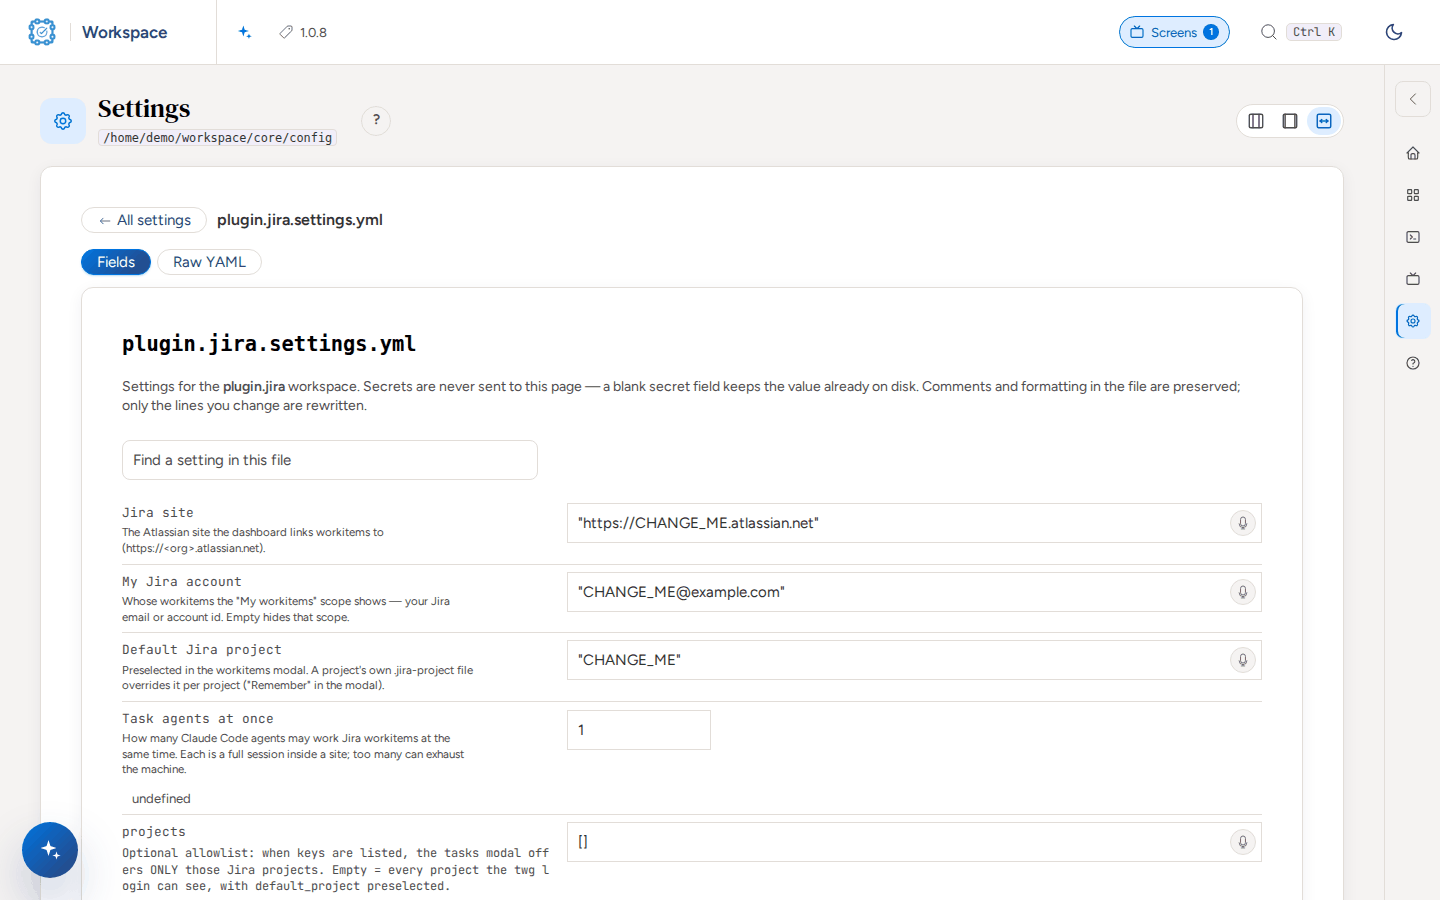
    The settings page of plugin.jira.settings.yml: the Jira site, account, default project and other fields, with a Save button.

Add a Webship Workspace plugin from the terminal

  1. In the workspace root, require the package. npm installs it into the dashboard.

    bash core/scripts/plugins.sh --require @webship.co/workspace-upsun
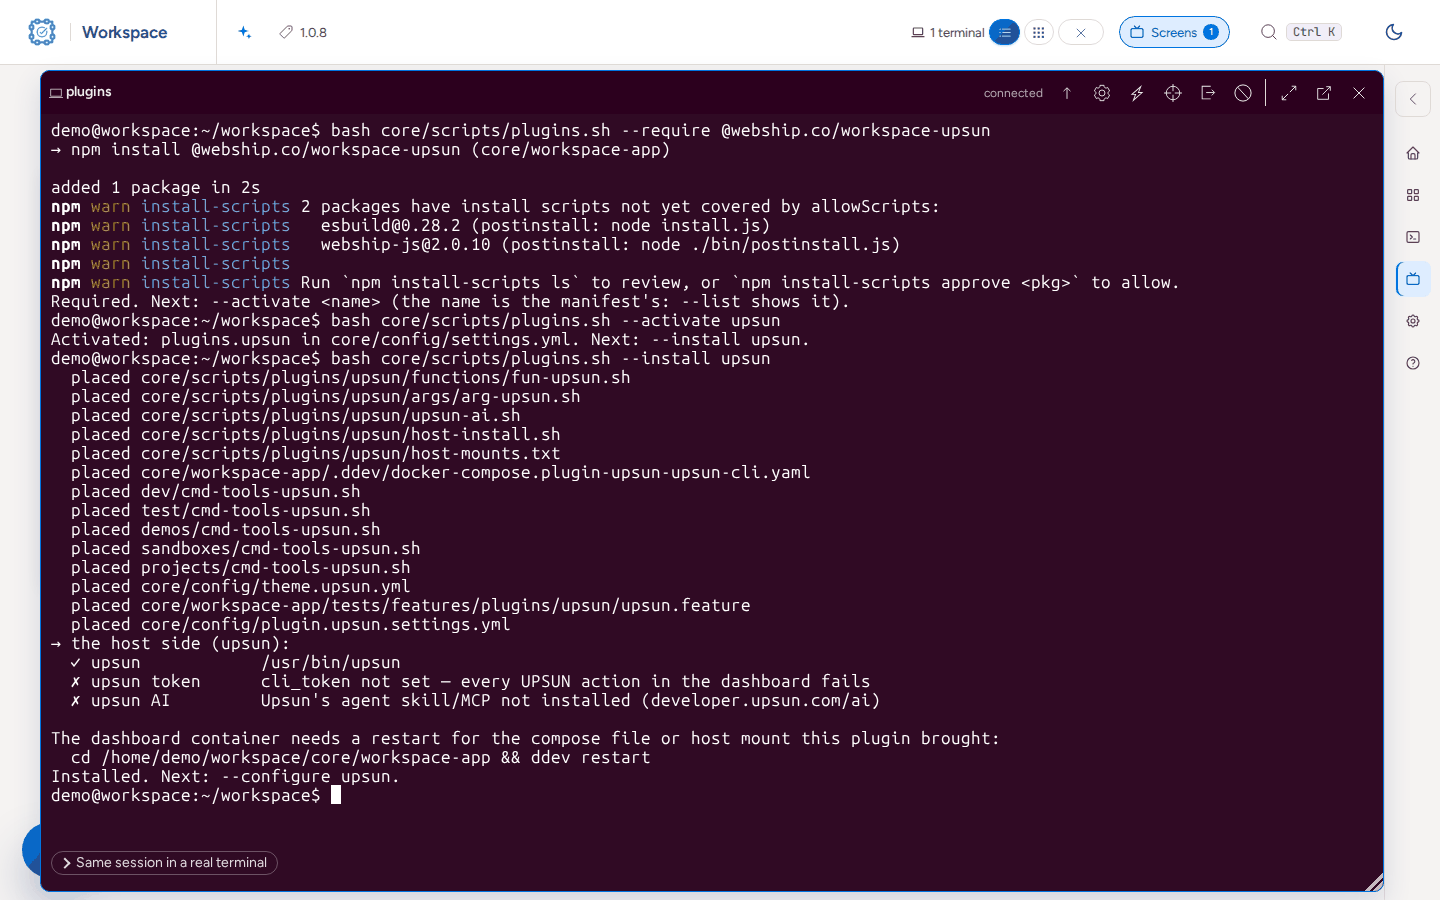
    A terminal in the dashboard running plugins.sh --require, --activate and --install for the Upsun plugin, with the files it placed and the host-side checks.

  2. Activate it. It is switched on in core/config/settings.yml.

    bash core/scripts/plugins.sh --activate upsun

    A terminal in the dashboard running plugins.sh --require, --activate and --install for the Upsun plugin, with the files it placed and the host-side checks.

  3. Install it. You see each file it placed, the host-side checks, and whether the dashboard container needs a restart.

    bash core/scripts/plugins.sh --install upsun

    A terminal in the dashboard running plugins.sh --require, --activate and --install for the Upsun plugin, with the files it placed and the host-side checks.

  4. Configure it. Its settings file is created from the template and the command prints where to edit it.

    bash core/scripts/plugins.sh --configure upsun
  5. List the plugins to see the step each is at.

    bash core/scripts/plugins.sh --list
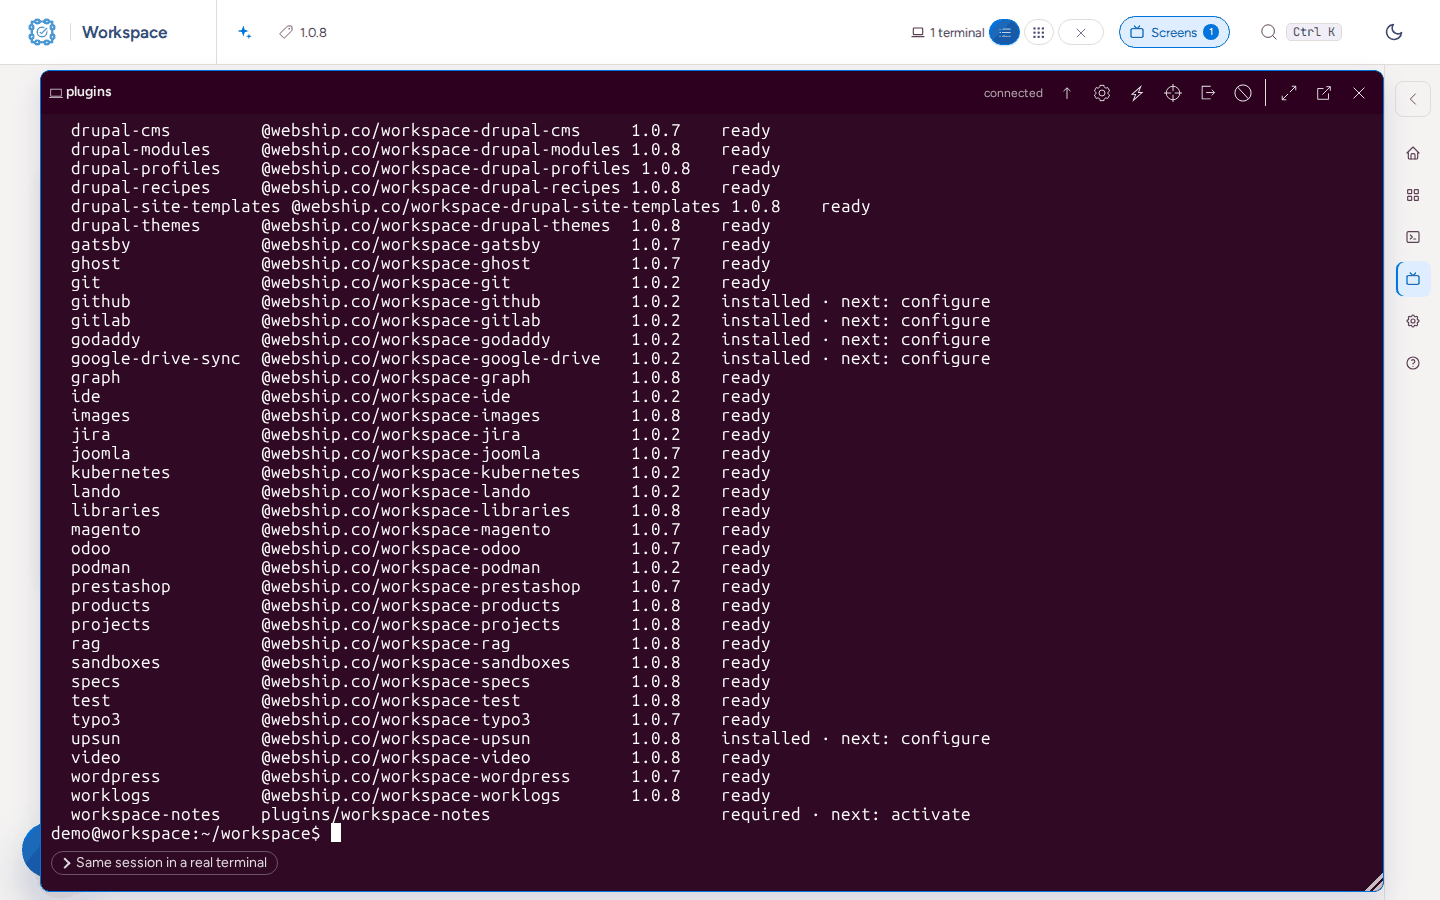
    A terminal showing the end of plugins.sh --list: each plugin with its package, version and step (ready, or installed · next: configure).

Find your way around

  1. Open the dashboard. The home page has a card for every workspace folder; the AI Assistant is on the left.
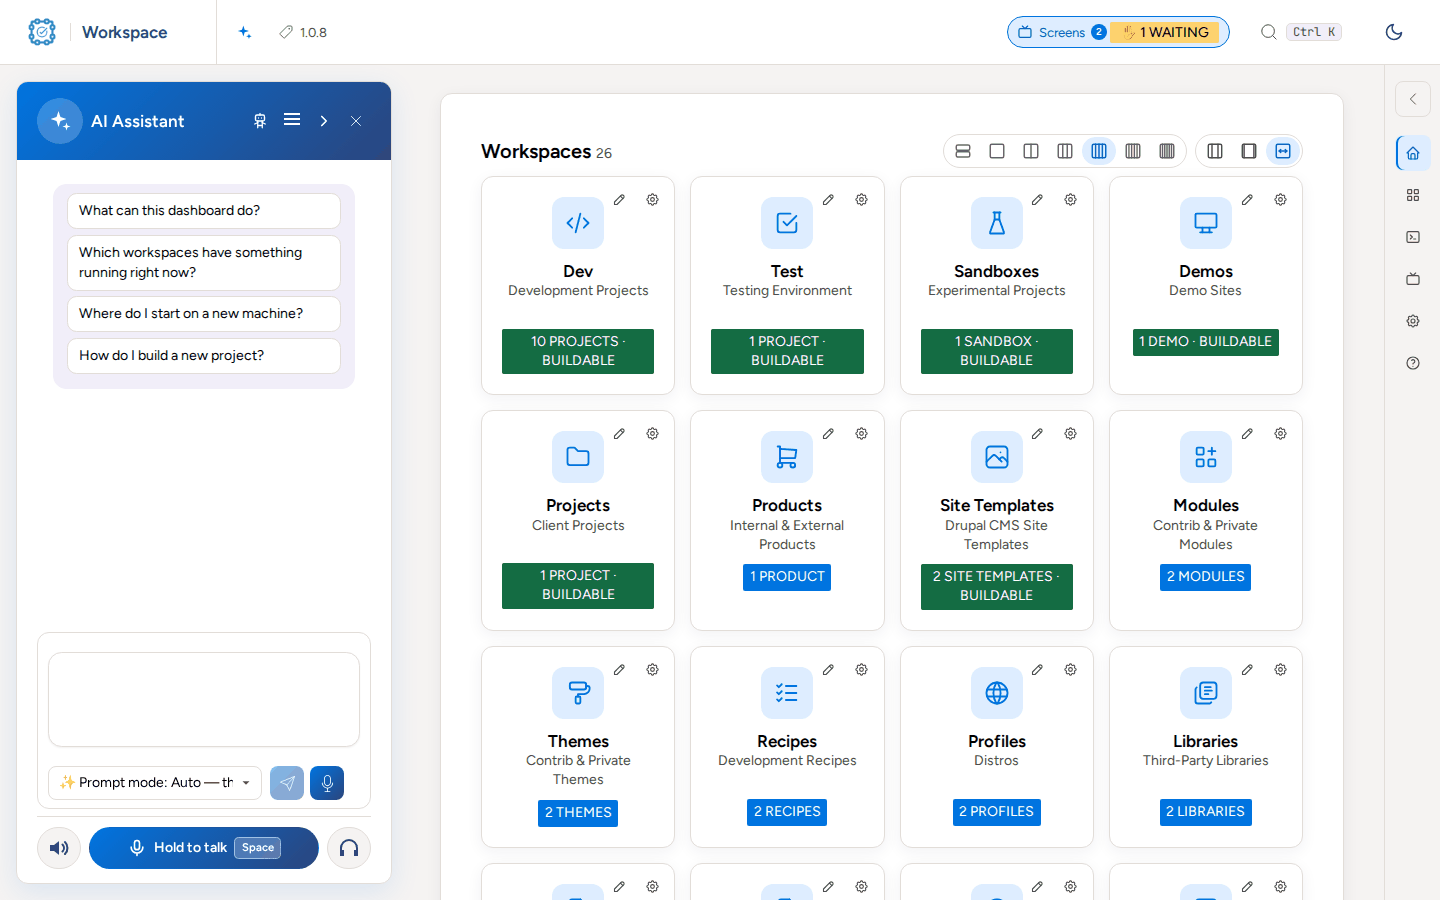
    The Webship Workspace home page with the AI Assistant on the left and a card for each workspace folder.

  2. Open a folder of sites, such as Dev. The Build form is at the top and every project is a row below it.
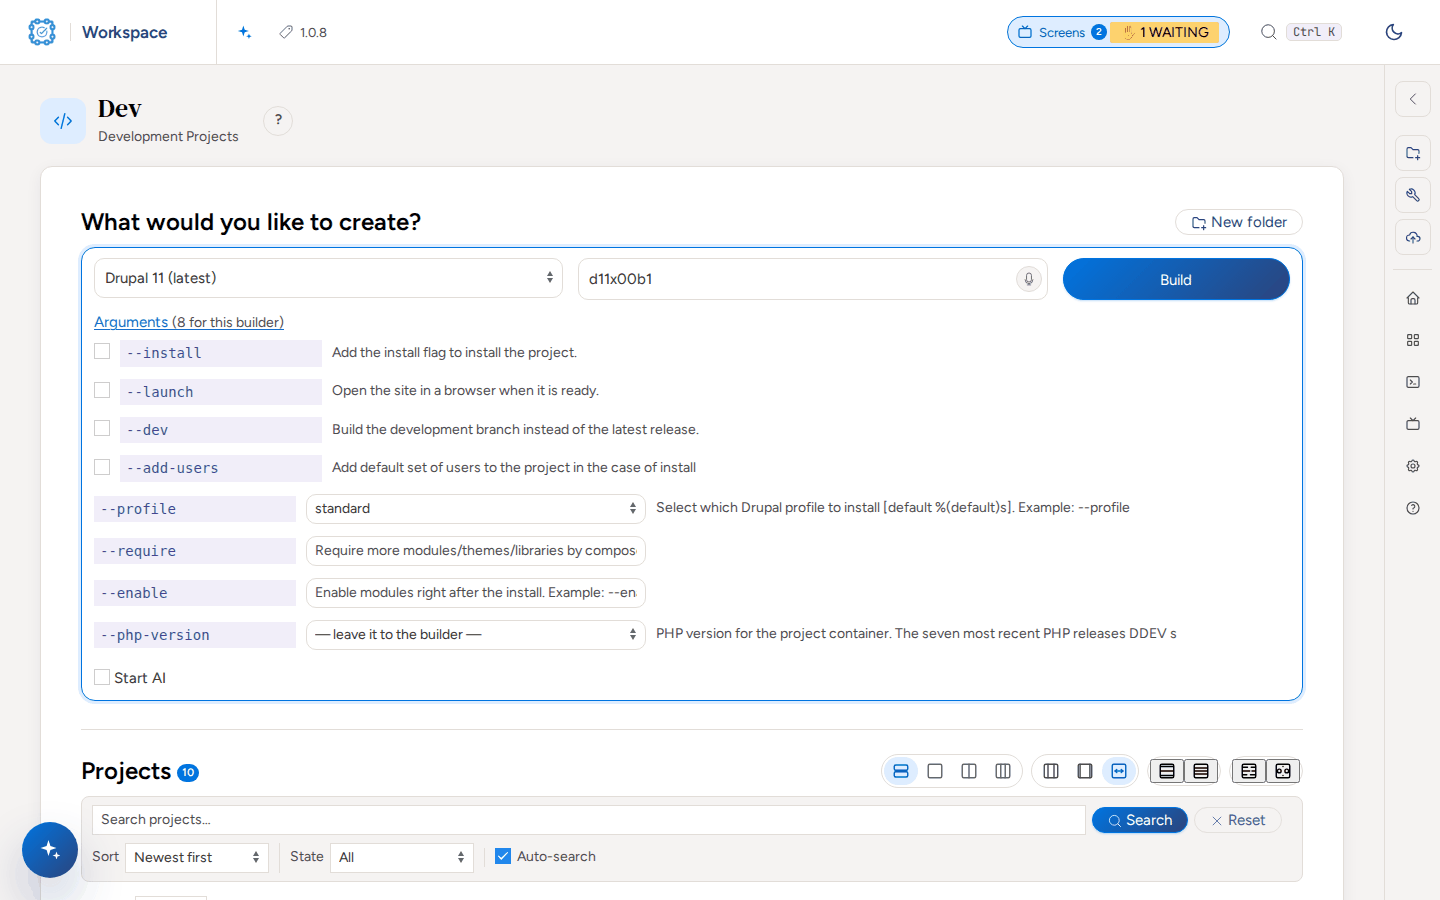
    The Dev page with What would you like to create?: a builder picker set to Drupal 11 (latest), a name field, the Build button, and the arguments of the builder (install, launch, dev, add-users, profile, require, enable, php-version).

  3. Open a menu on a row, such as DDEV, to act on that project.
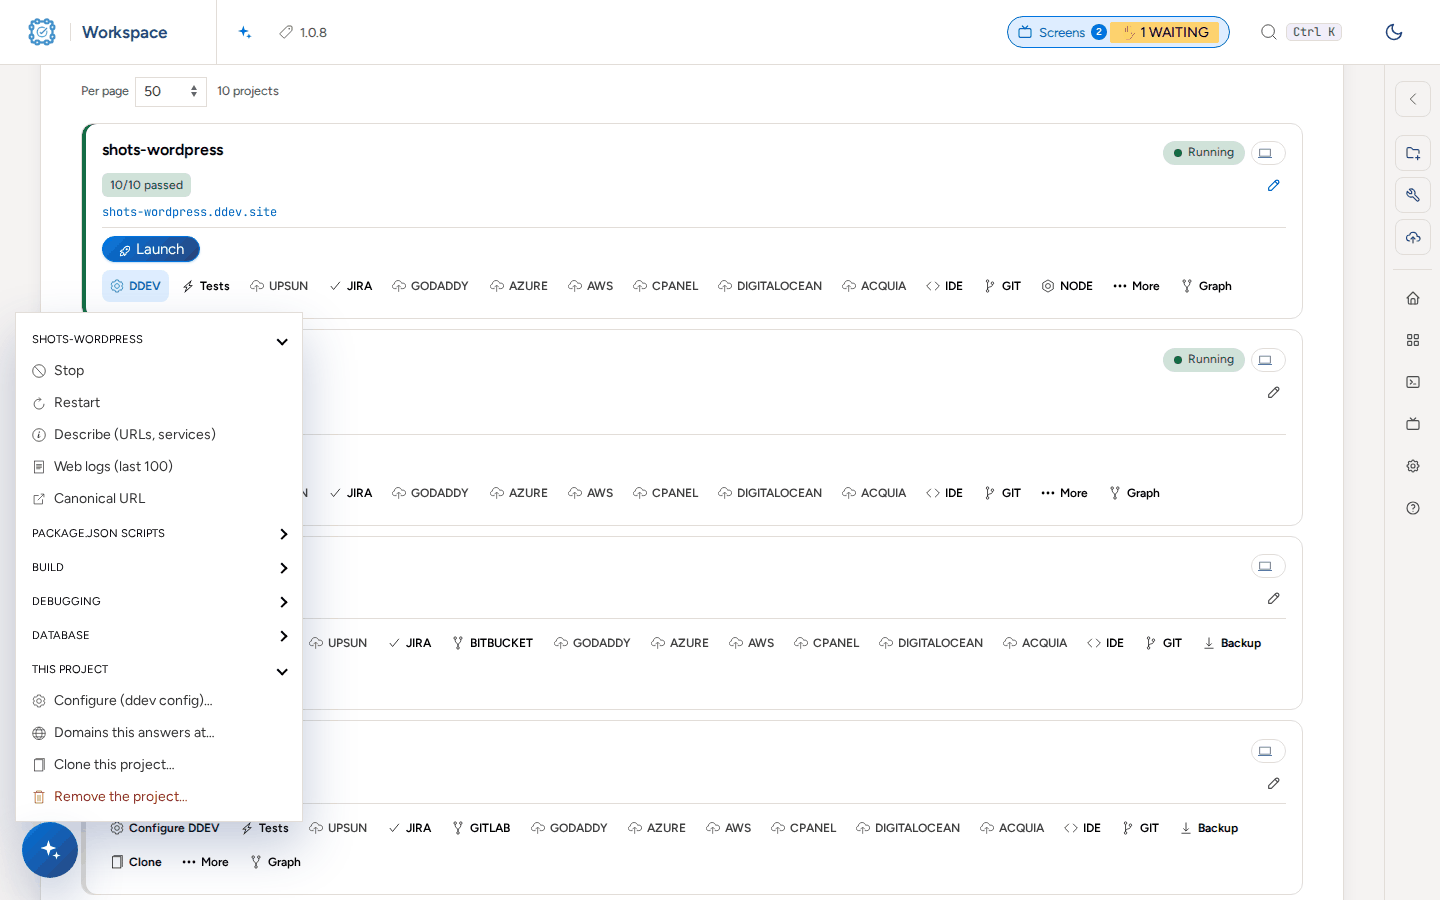
    The DDEV menu open on shots-wordpress: Stop, Restart, Describe, Web logs, Canonical URL, groups for package.json scripts, build, debugging and database, then Configure, Domains, Clone and Remove.

  4. Open Screens in the header to watch long runs and open their terminals.
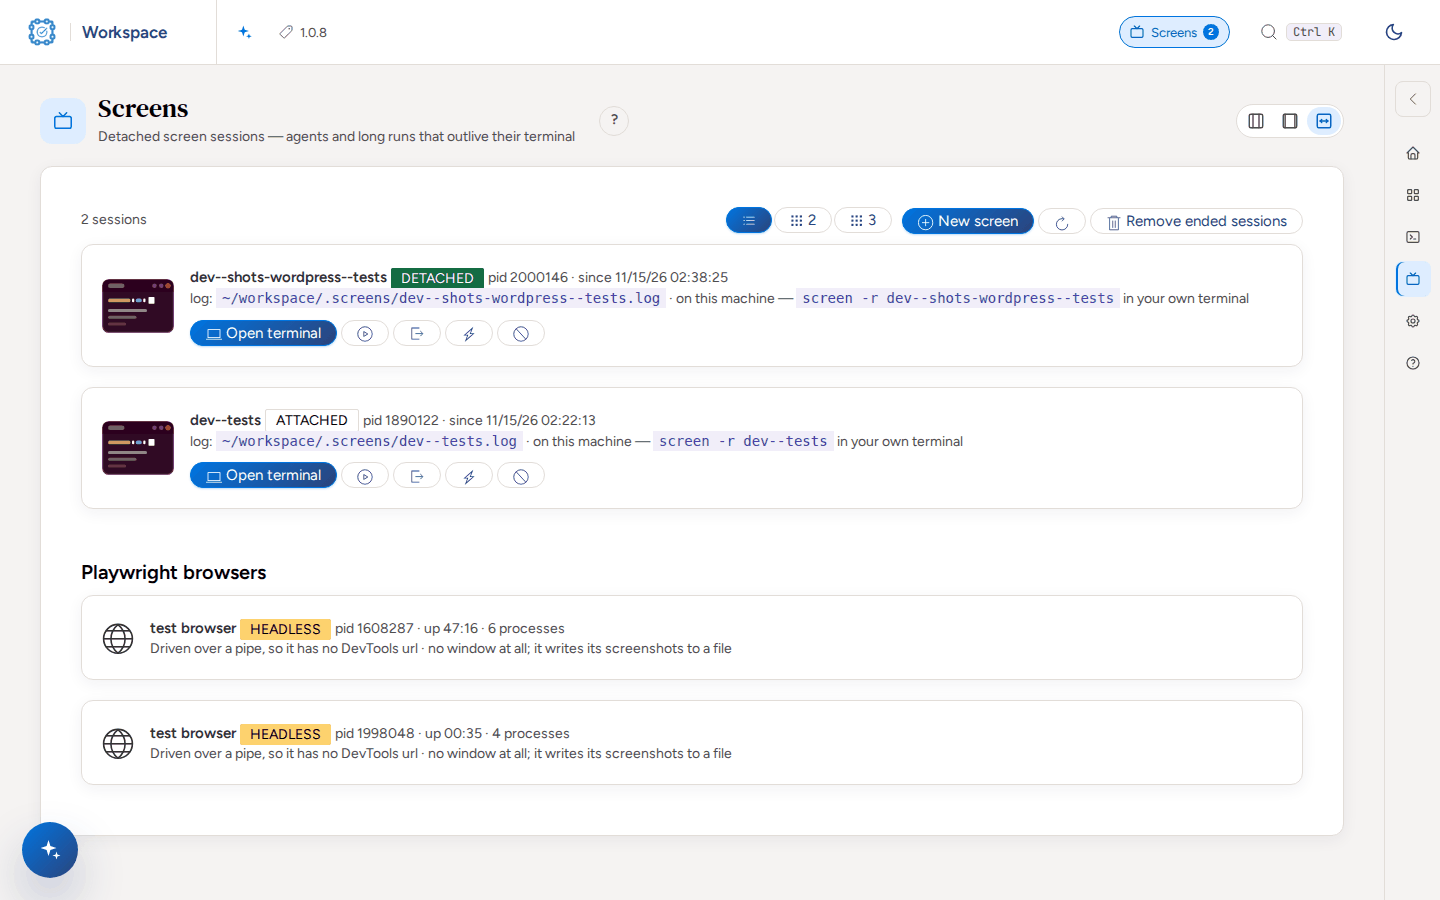
    The Screens page with two sessions, a test run and a terminal, each with Open terminal and its log path, and the Playwright browsers running on the machine.

  5. Open Settings for the dashboard, each plugin and each workspace folder.
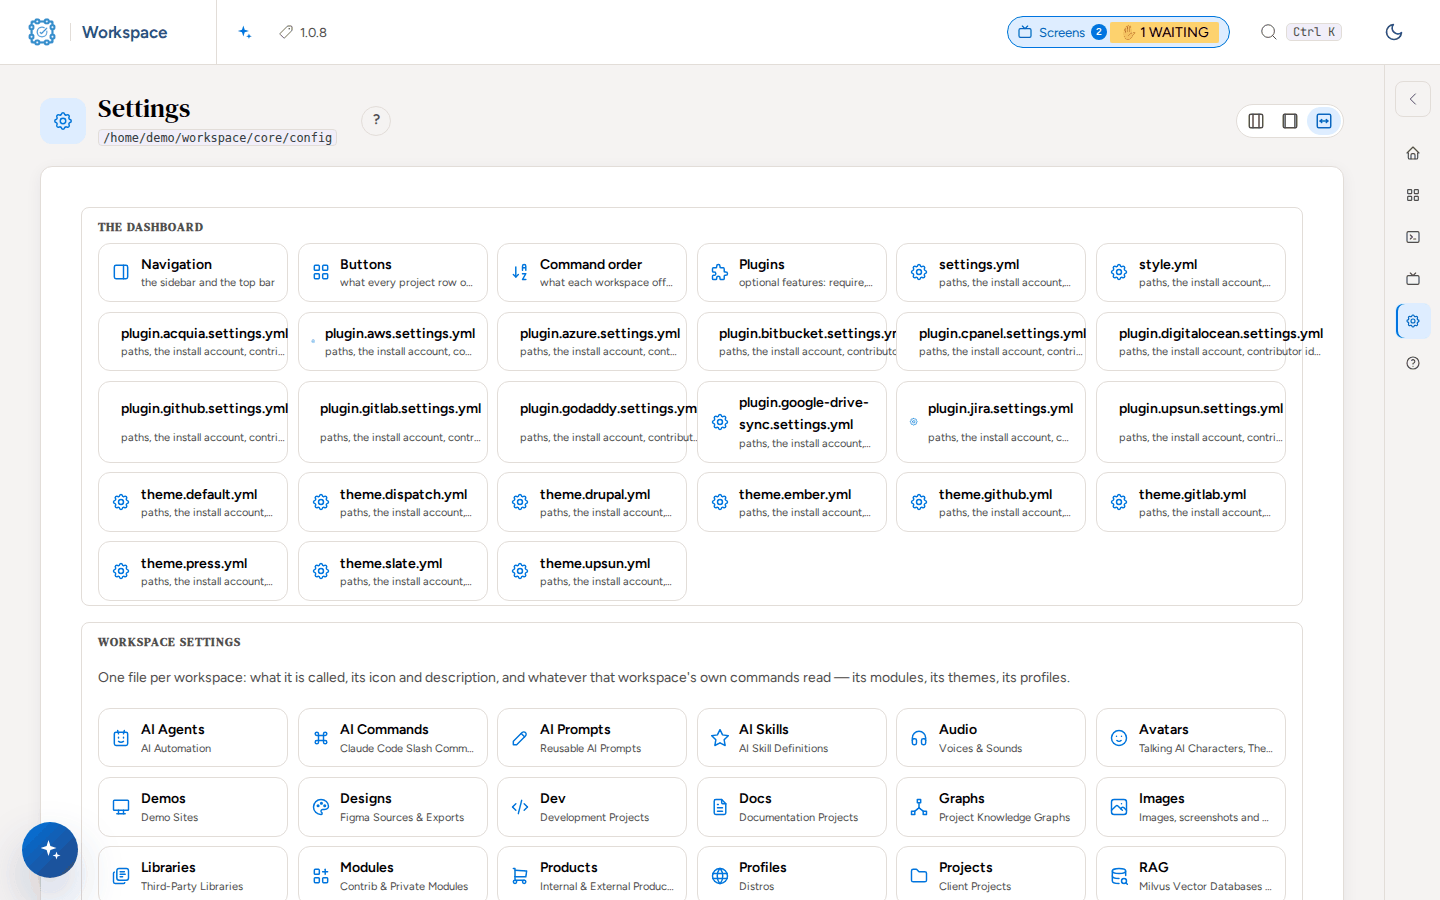
    The Settings page: the dashboard sections (Navigation, Buttons, Command order, Plugins), settings.yml, style.yml, each plugin file and theme, and one file per workspace folder.

  6. Open a workspace folder's settings to change its name, description and icon.
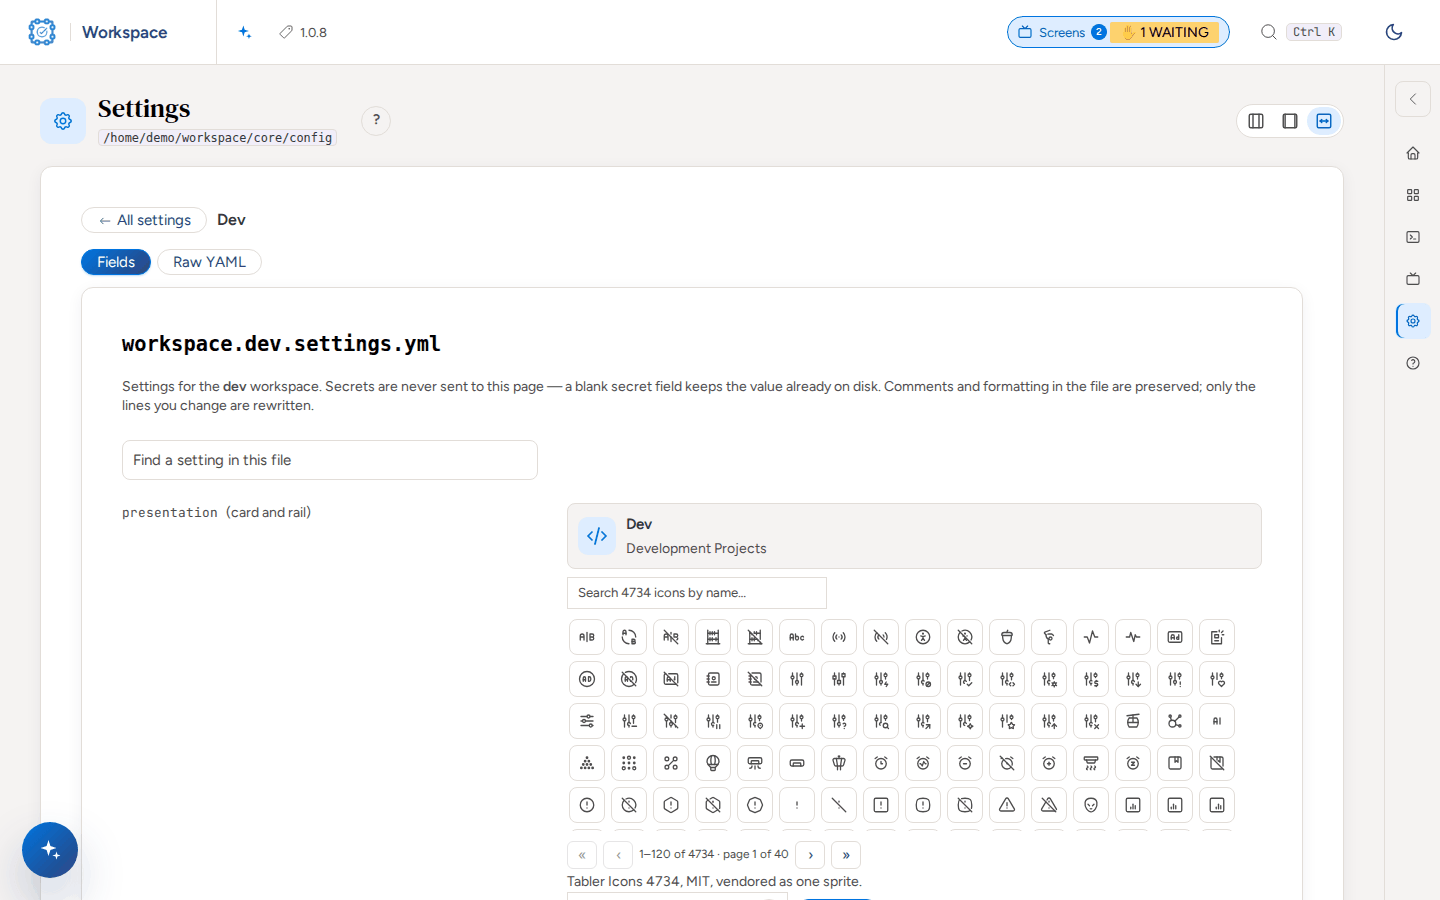
    The settings page of workspace.dev.settings.yml: the presentation of the Dev card with its name, description and an icon picker.

Test a project with Webship-js

  1. Open Tests on the project row. Before the setup it says "not set up".
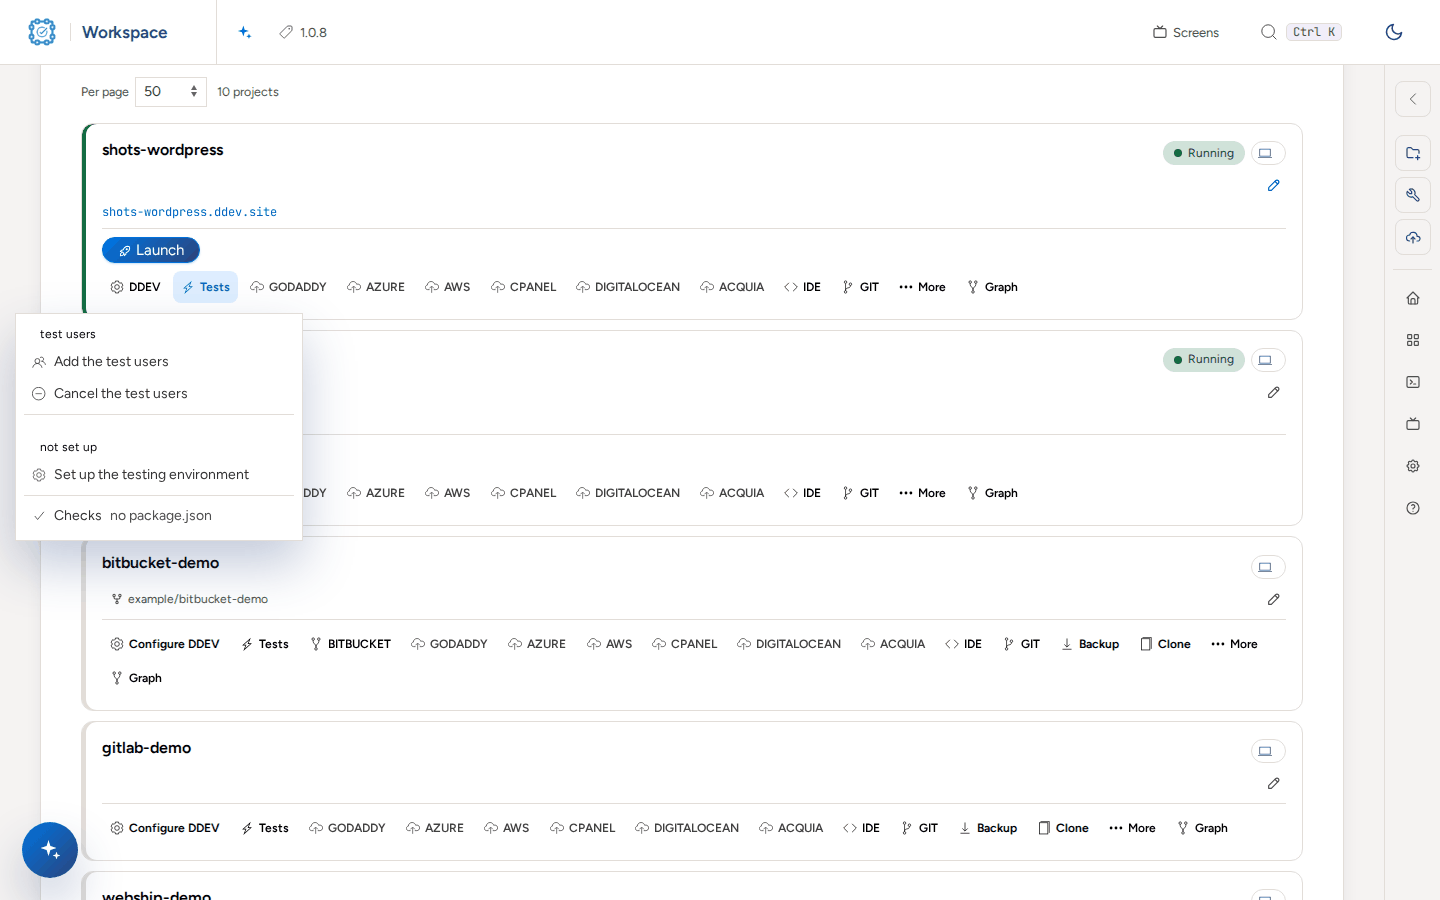
    The Tests menu open on shots-wordpress: Add the test users, Cancel the test users, not set up, Set up the testing environment.

  2. Set up testing: choose Set up the testing environment, or run the command in the folder of the project's workspace. It adds the Webship-js add-on, the JS dependencies and the browser, and restarts the project.

    bash cmd-tools-testing.sh shots-wordpress
  3. Look at what it added: tests/ with features, reports, screenshots, selectors and step-definitions, and cucumber.js, which loads the Webship-js steps, the step pack of the platform (@webship-js/wordpress-steps here) and the accounts registry.

    ls shots-wordpress/tests shots-wordpress/tests/features
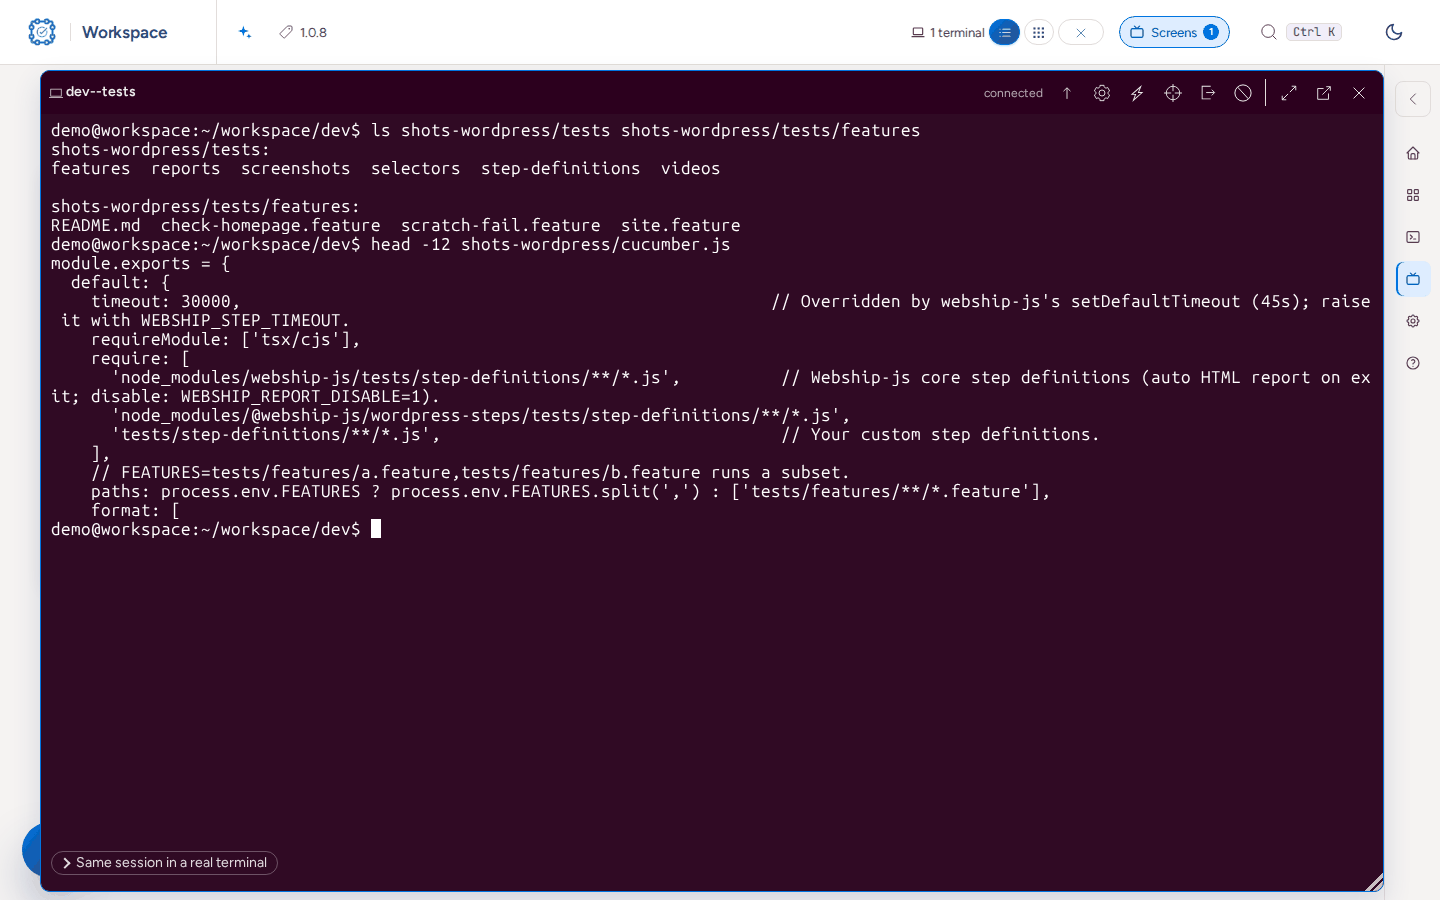
    A terminal listing tests/ with features, reports, screenshots, selectors and step-definitions, and the top of cucumber.js where the Webship-js core steps and @webship-js/wordpress-steps are required.

  4. Read the first feature it gives, tests/features/site.feature: the front page, the login screen, each default account and its role.

    cat shots-wordpress/tests/features/site.feature
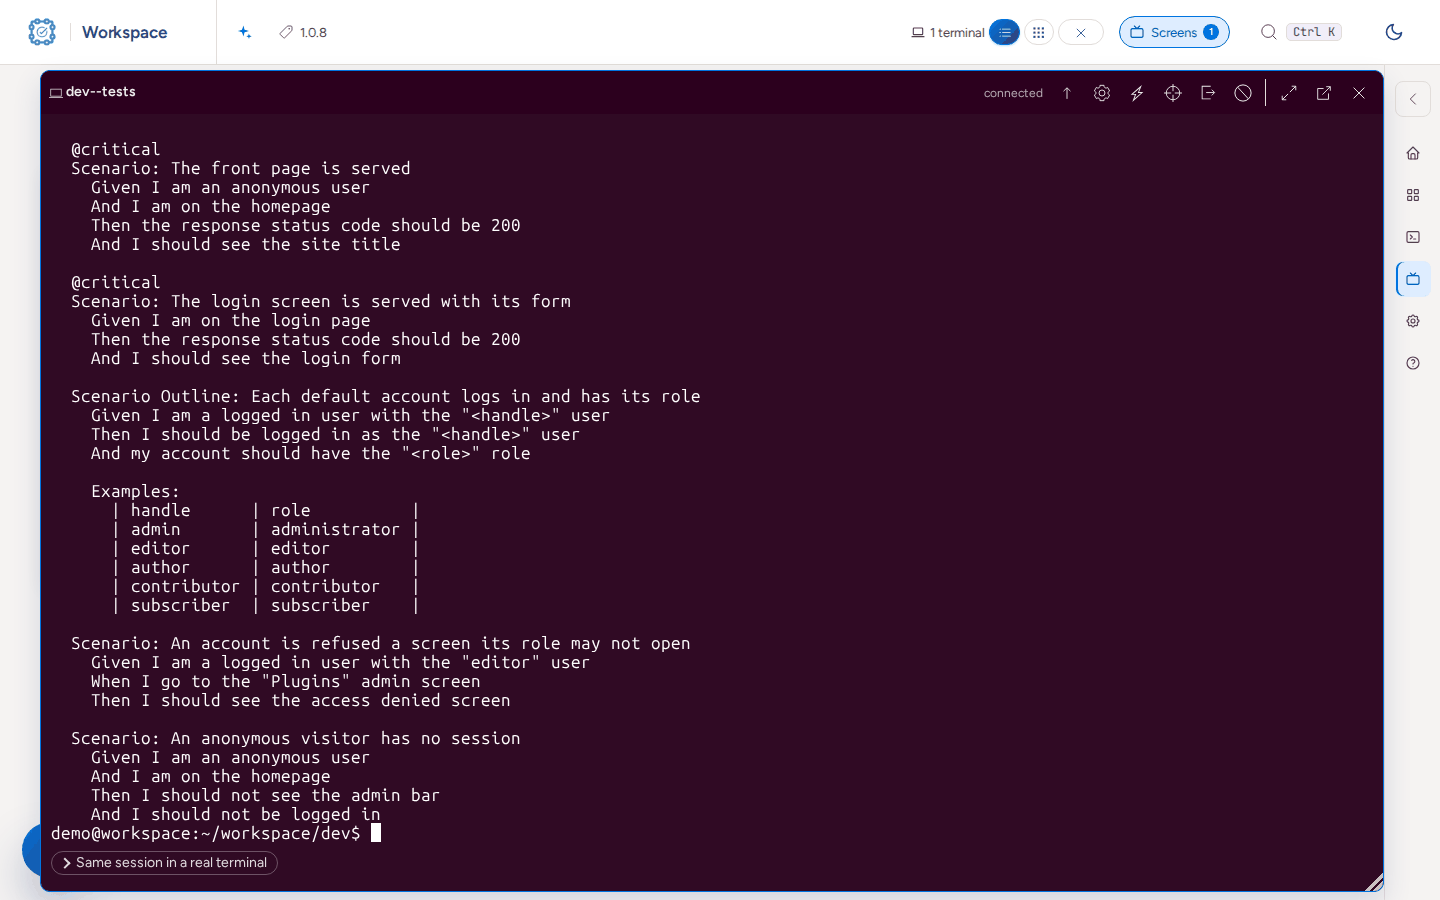
    A terminal showing tests/features/site.feature: the front page and the login screen are served, each default account logs in with its role, an editor is refused the Plugins screen, a visitor has no session.

  5. Run all: choose Run the tests in the Tests menu. The run starts as a screen session you can watch on Screens.

    bash cmd-tools-testing.sh shots-wordpress --run
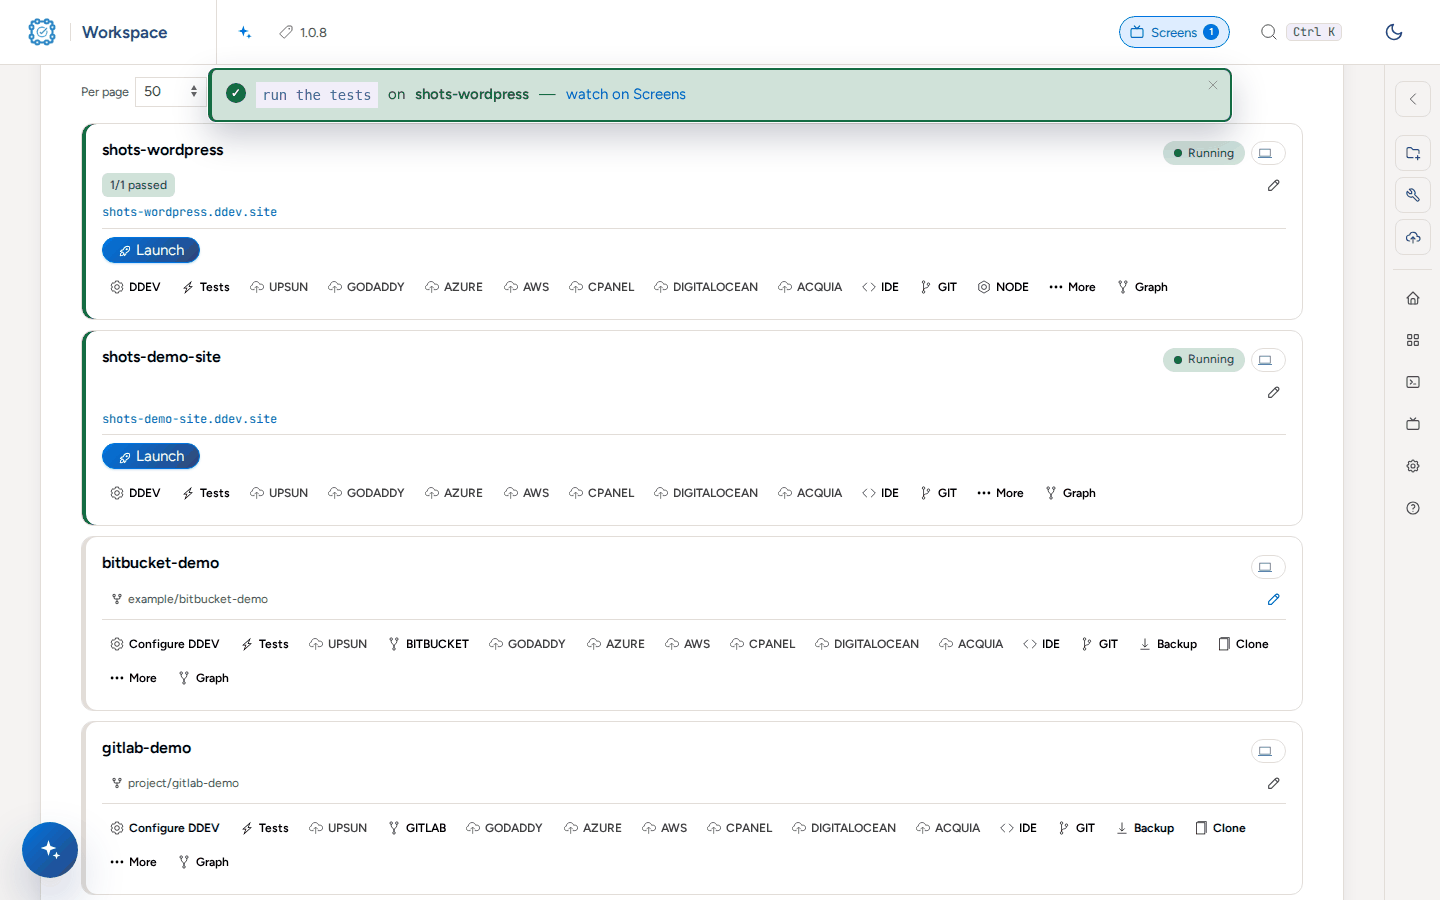
    A green message at the top of the Dev page: run the tests on shots-wordpress, watch on Screens.

  6. When it ends the project row shows the result, here 10/10 passed.
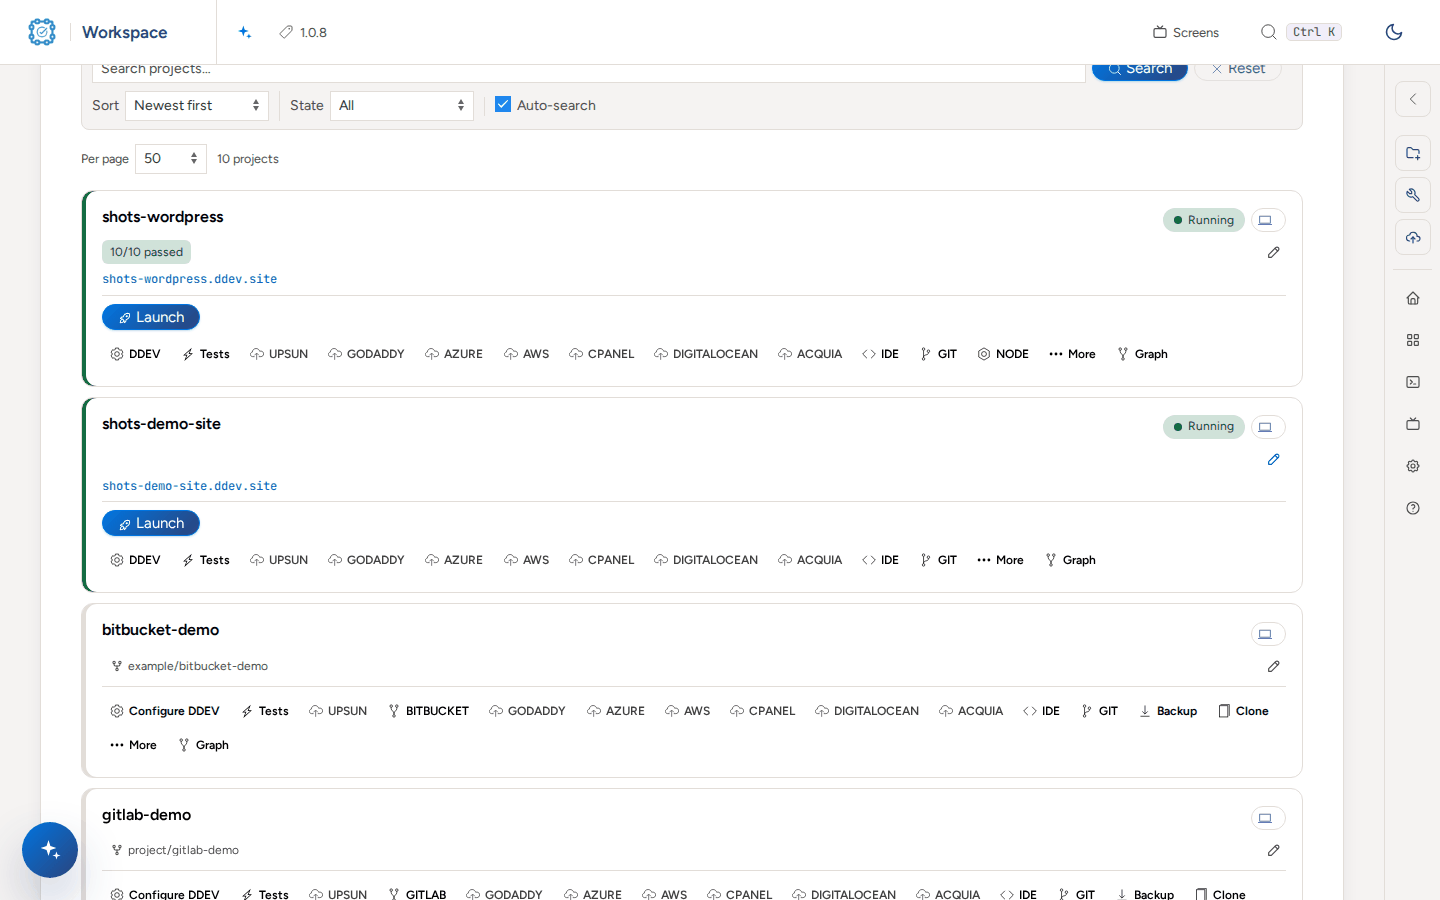
    The shots-wordpress row with a green 10/10 passed badge under its name.

  7. Open the report from the Tests menu: the totals, the HTML report, Download as PDF and JSON.
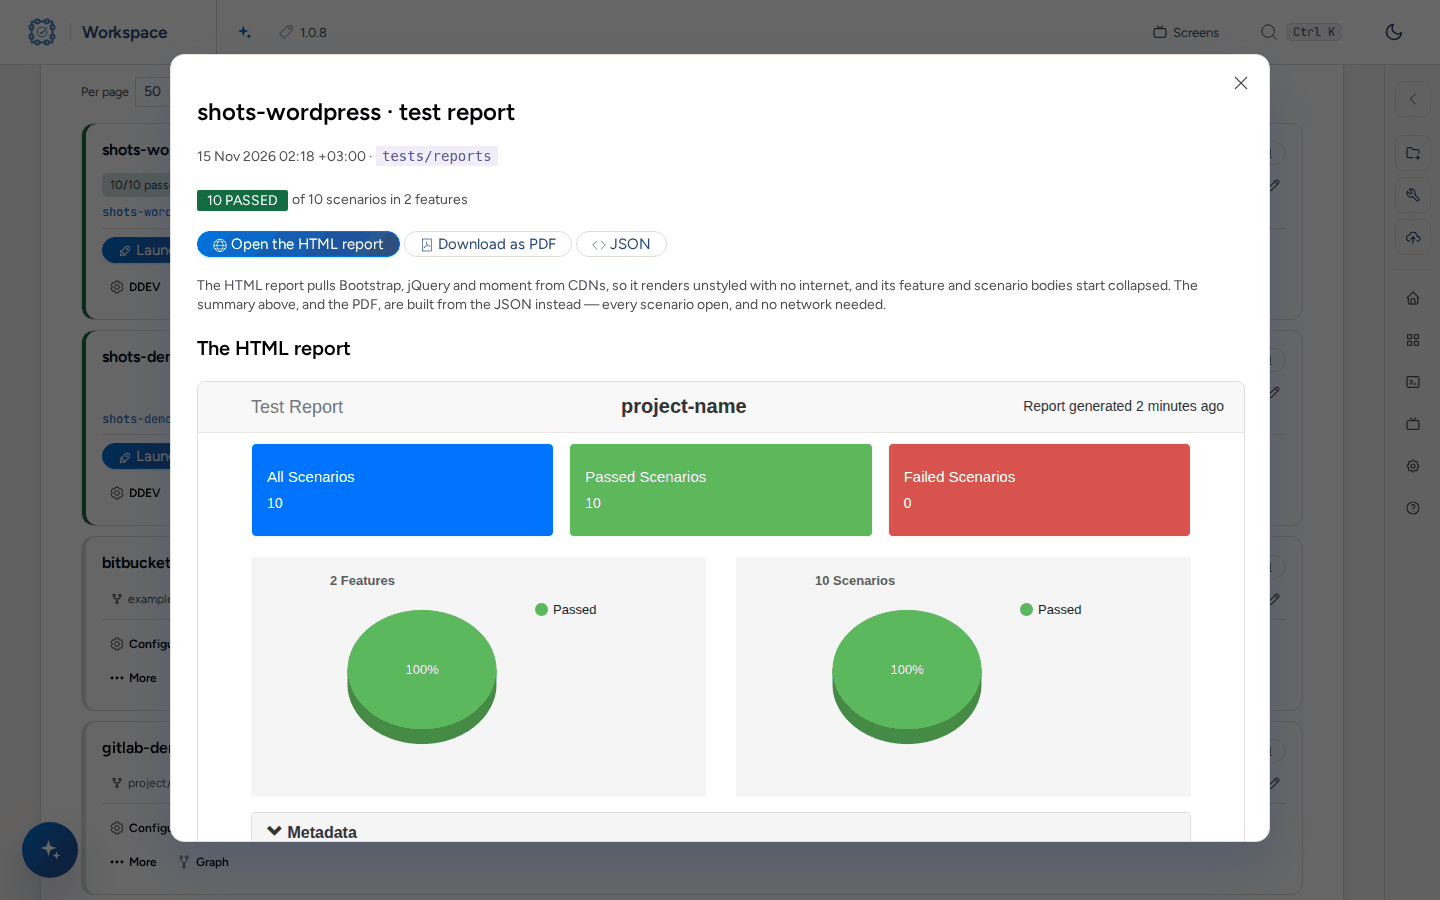
    The test report window: 10 PASSED of 10 scenarios in 2 features, the buttons Open the HTML report, Download as PDF and JSON, and the HTML report with its totals and charts.

  8. Run by tag from a terminal.

    bash cmd-tools-testing.sh shots-wordpress --run --tags @critical
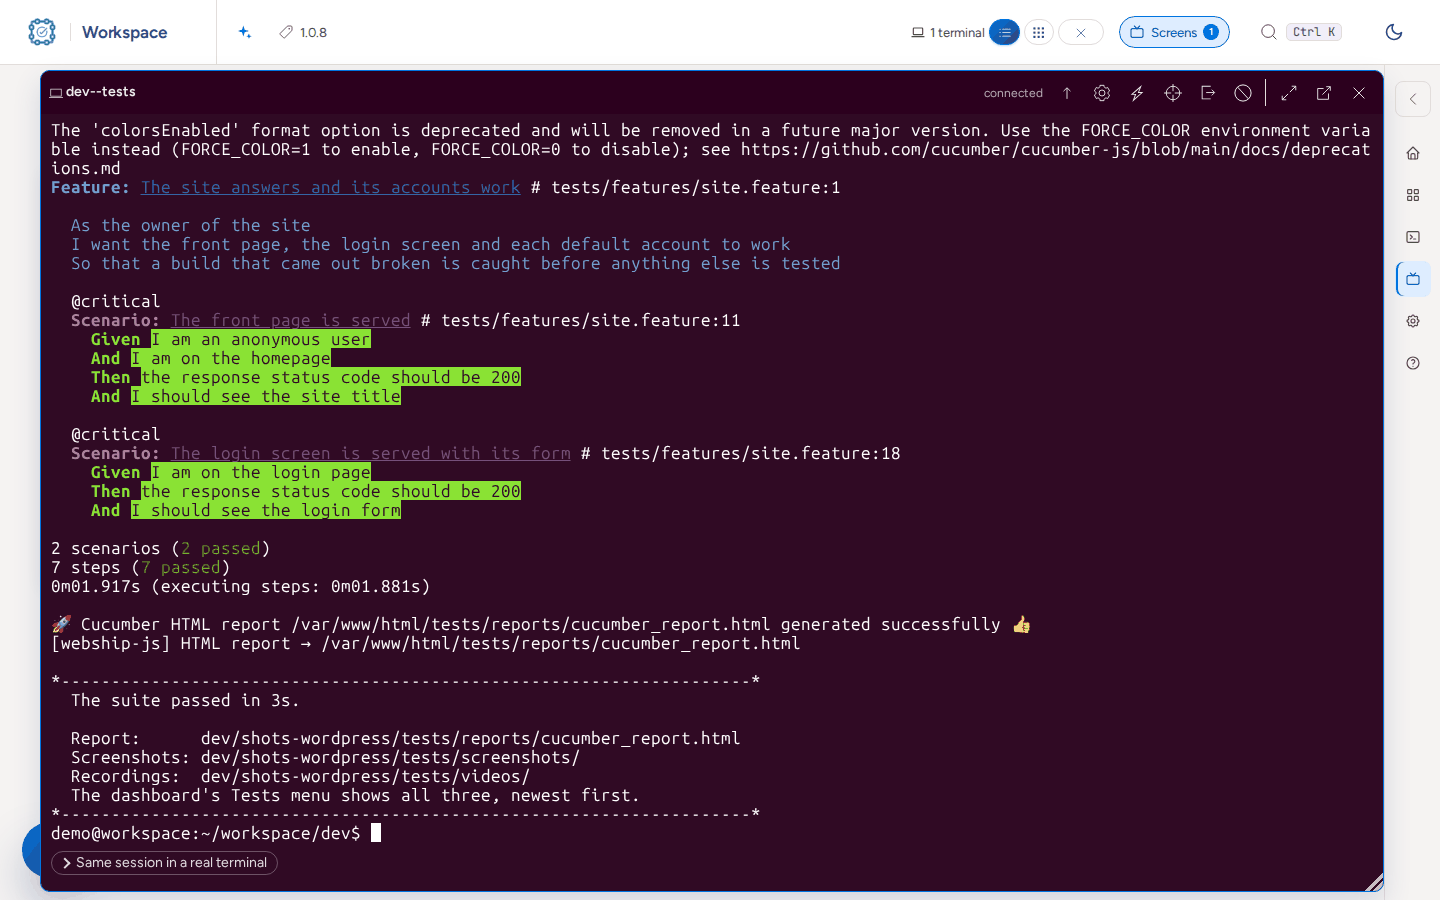
    A terminal after cmd-tools-testing.sh --run --tags @critical: two scenarios of site.feature, 2 scenarios passed, the report paths.

  9. Run one feature by its path.

    bash cmd-tools-testing.sh shots-wordpress --run --path tests/features/check-homepage.feature
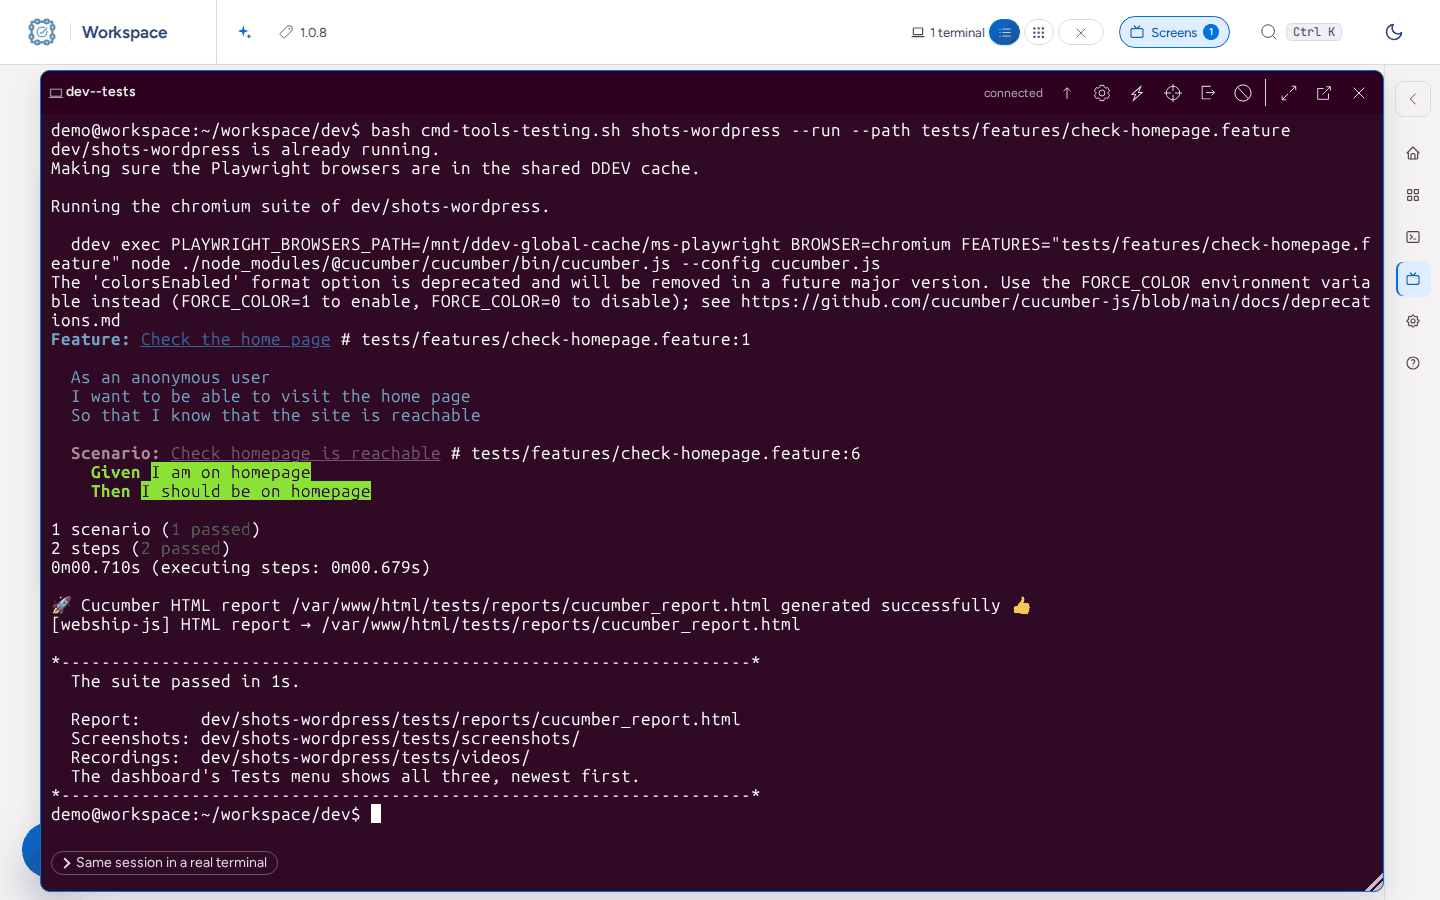
    A terminal after cmd-tools-testing.sh --run --path tests/features/check-homepage.feature: the command it runs in the container, 1 scenario passed, the report paths.

  10. Do a dry run: every step is matched against the definitions and no browser opens.

    bash cmd-tools-testing.sh shots-wordpress --dry-run
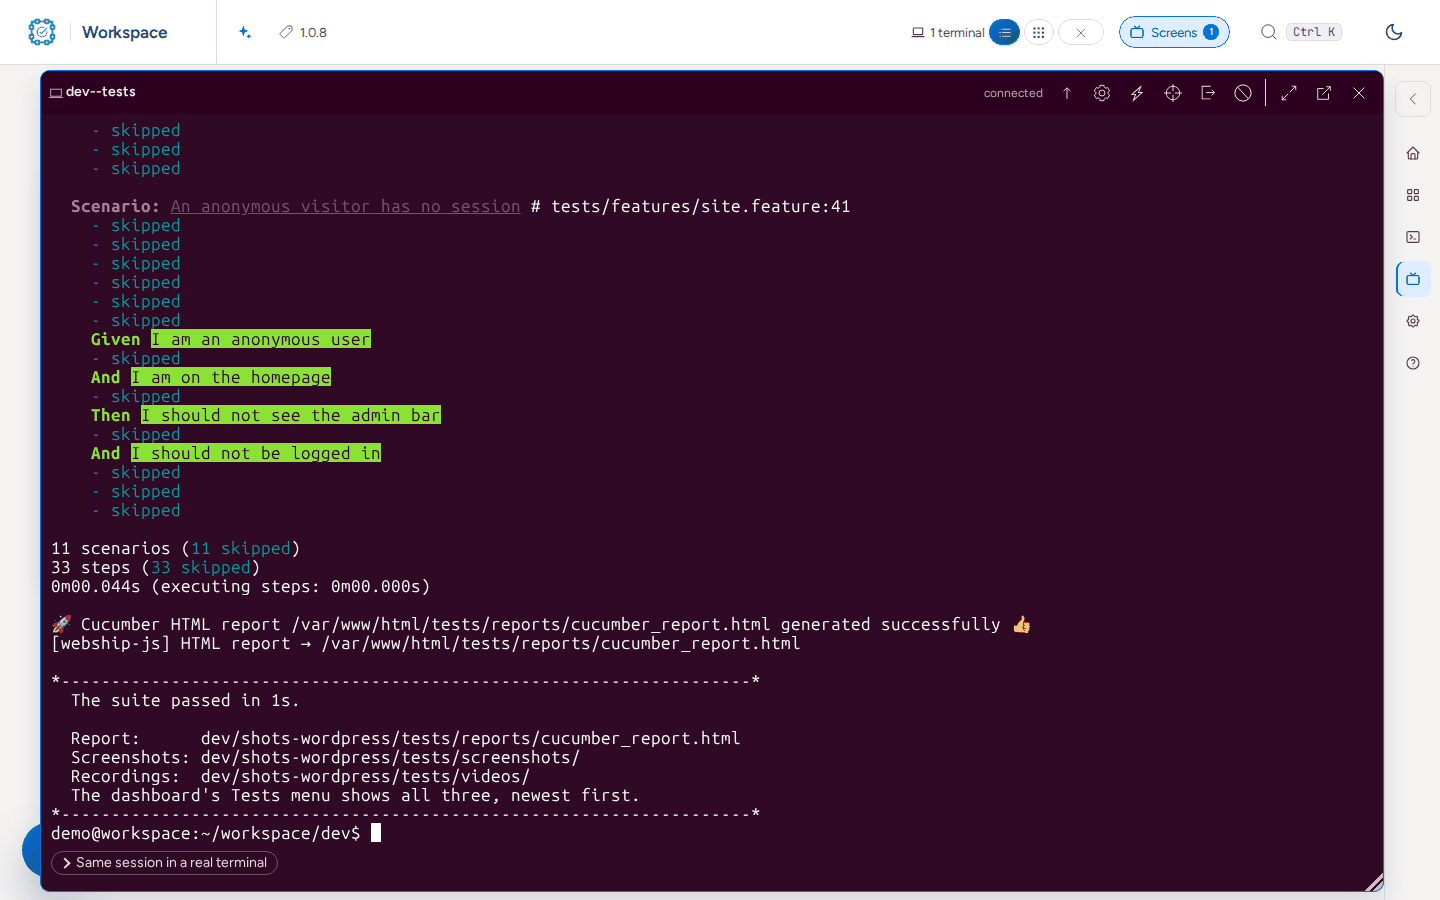
    A terminal after cmd-tools-testing.sh --dry-run: every step skipped, 11 scenarios (11 skipped), 33 steps, in under a second.

  11. When a scenario fails the terminal shows the step and the error.

    bash cmd-tools-testing.sh shots-wordpress --run --path tests/features/scratch-fail.feature
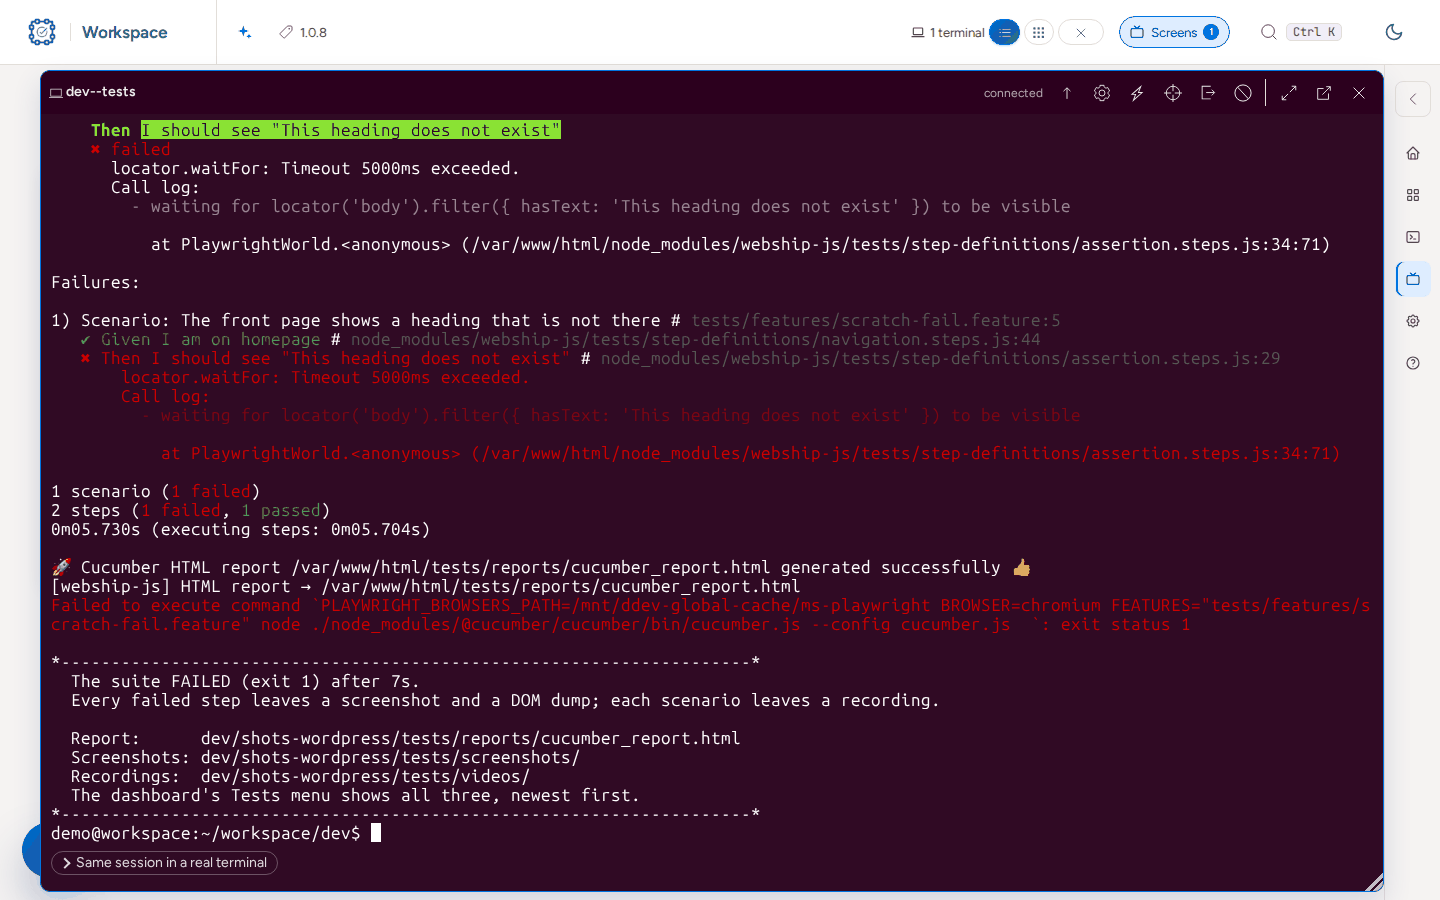
    A terminal after a run that fails: the step that timed out, 1 scenario (1 failed), and The suite FAILED (exit 1) with the report, screenshots and recordings paths.

  12. The row badge turns red, and the report in the dashboard counts the failure.
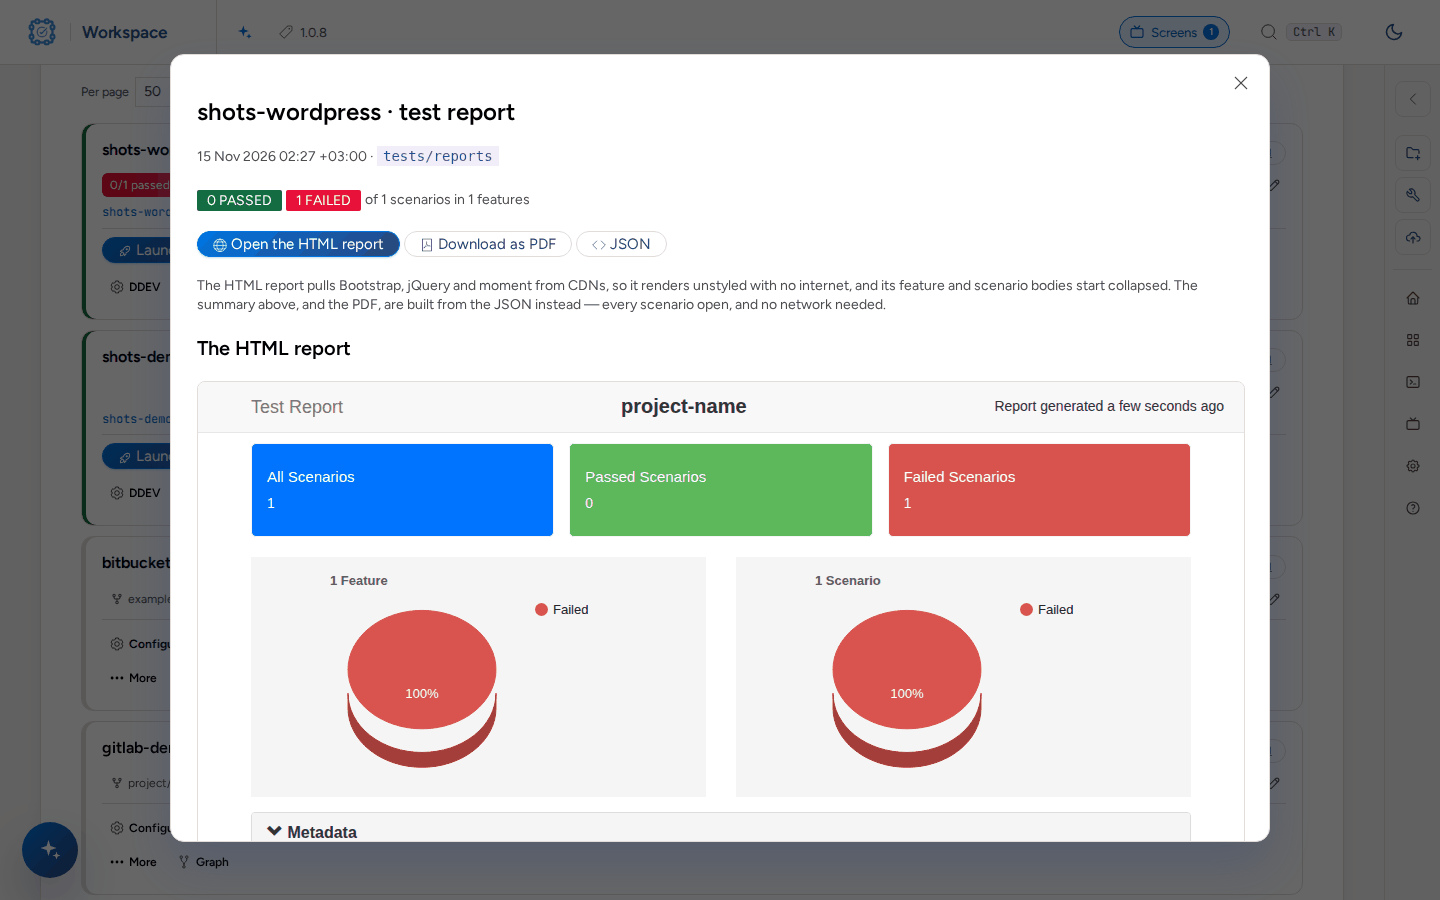
    The test report window with 0 PASSED and 1 FAILED of 1 scenarios, and the HTML report with a red Failed chart.

  13. Open the HTML report, the feature, the scenario and Show Error to read the failed step.
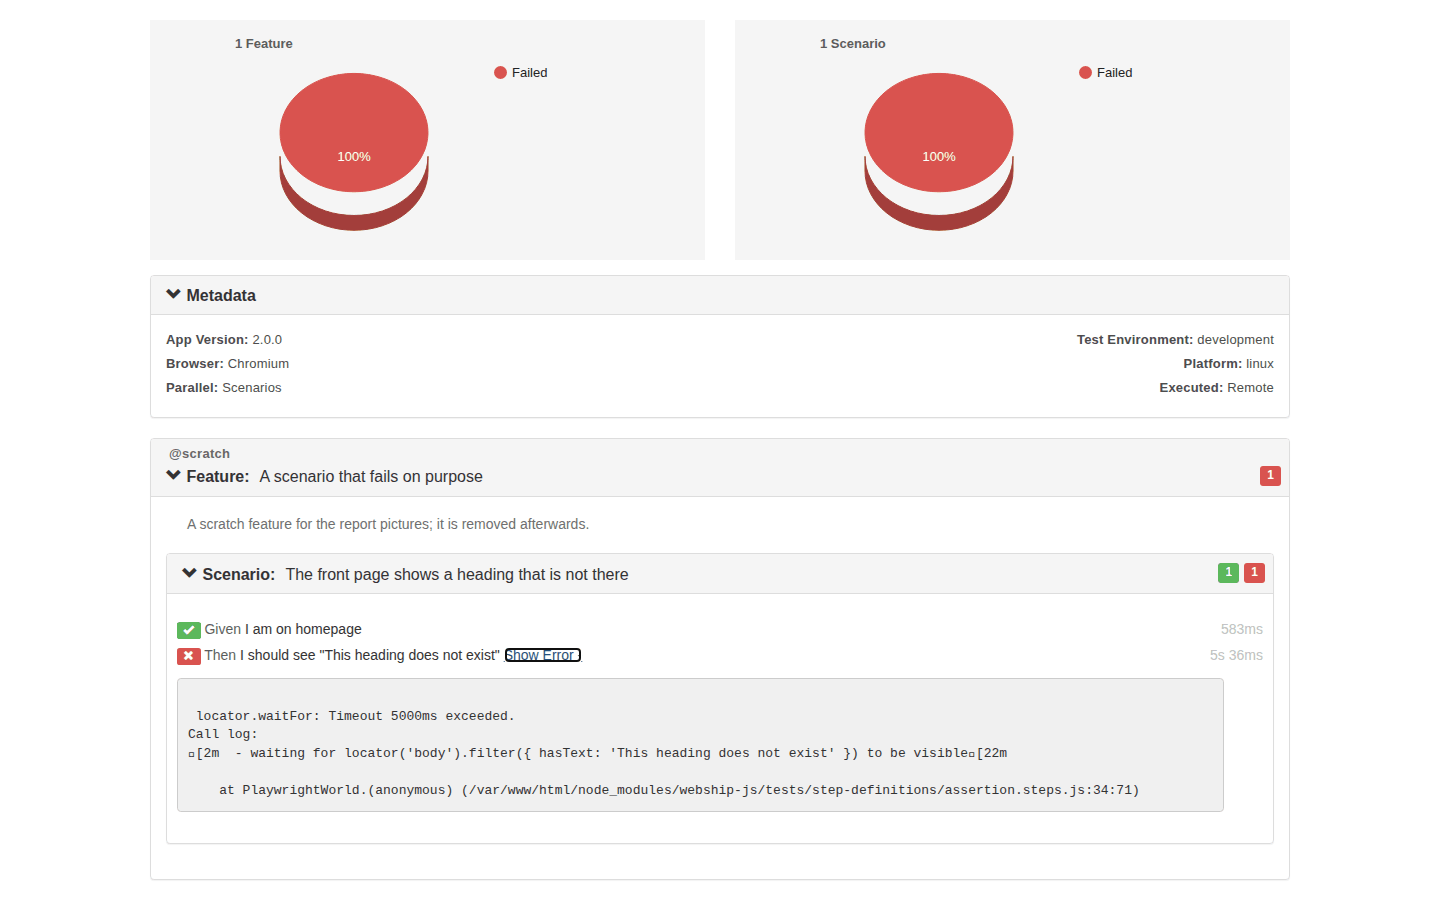
    The Webship-js HTML report with the failed scenario open: the passed Given step, the failed Then step and its error text.

  14. Open the failure screenshot in tests/screenshots.
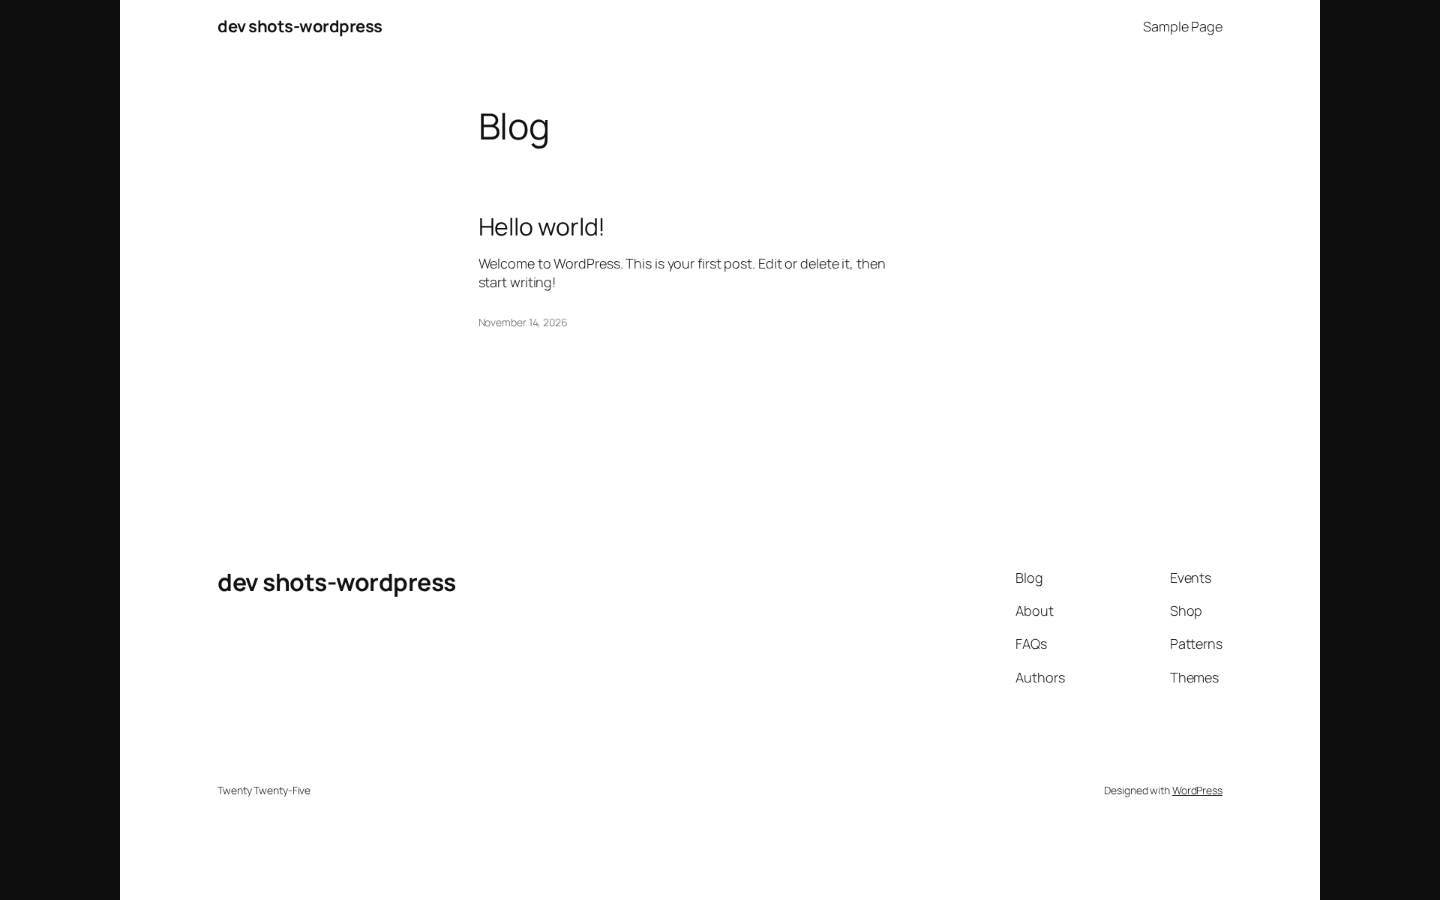
    The screenshot Webship-js saved at the failed step: the front page of the WordPress demo site.

  15. Open the DOM dump saved beside it.

    The HTML file Webship-js saved at the failed step, opened in the browser: the markup of the front page without its styles.

  16. To record, set video: { mode: 'on', dir: 'tests/videos' } in worldParameters of cucumber.js and run again. Each scenario leaves a .webm.

    bash cmd-tools-testing.sh shots-wordpress --run --path tests/features/check-homepage.feature
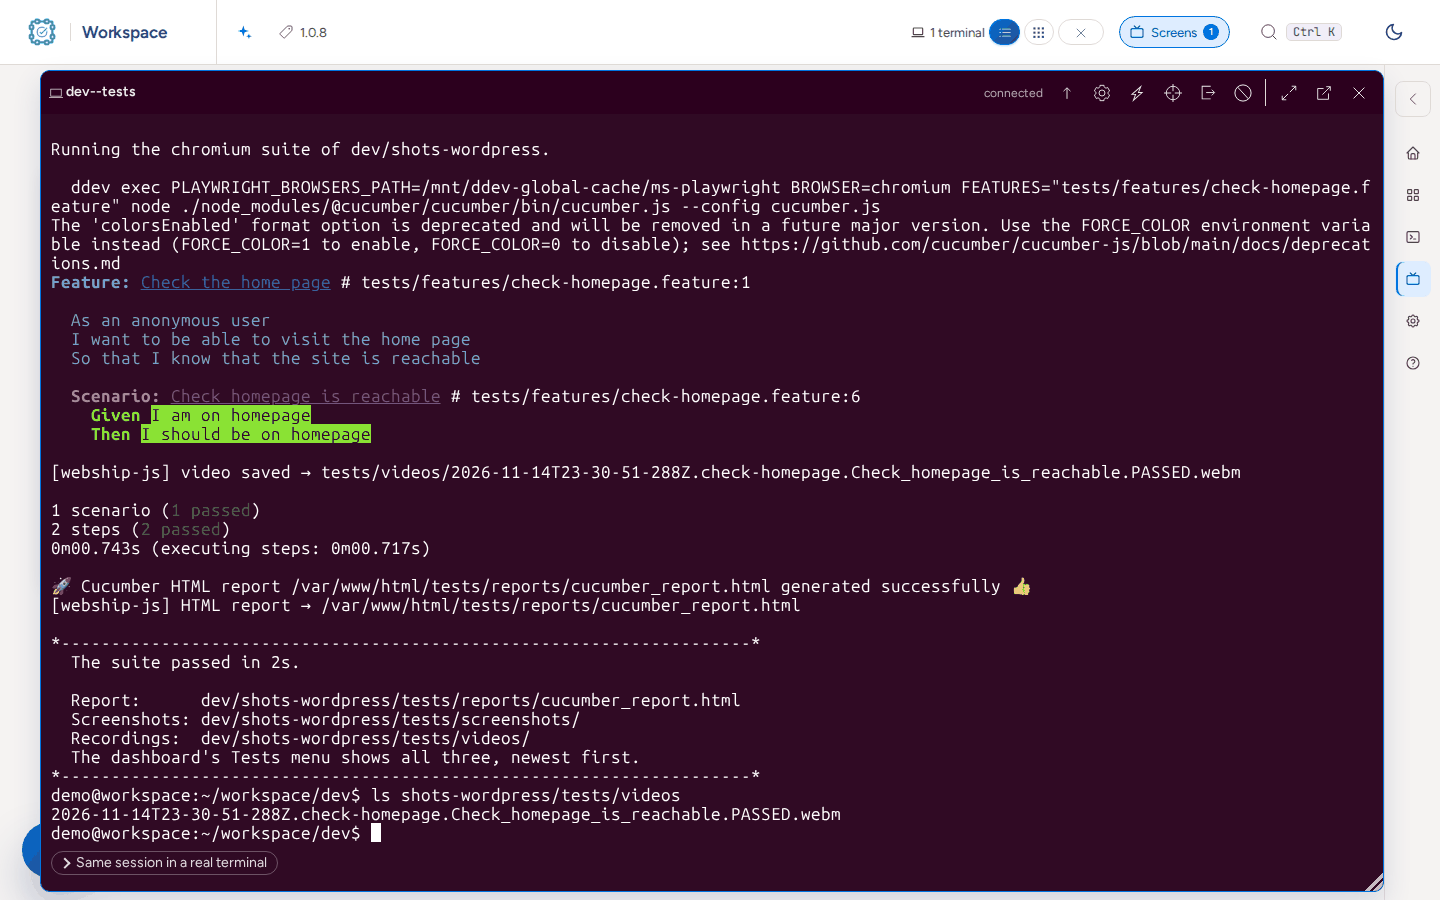
    A terminal after a run with recording on: video saved → tests/videos/…PASSED.webm, 1 scenario passed, and the file listed in tests/videos.

  17. Open the recording.

    The recording of a scenario playing in the browser: the front page of the WordPress demo site.

  18. Press Download as PDF in the report for the same run as a document.
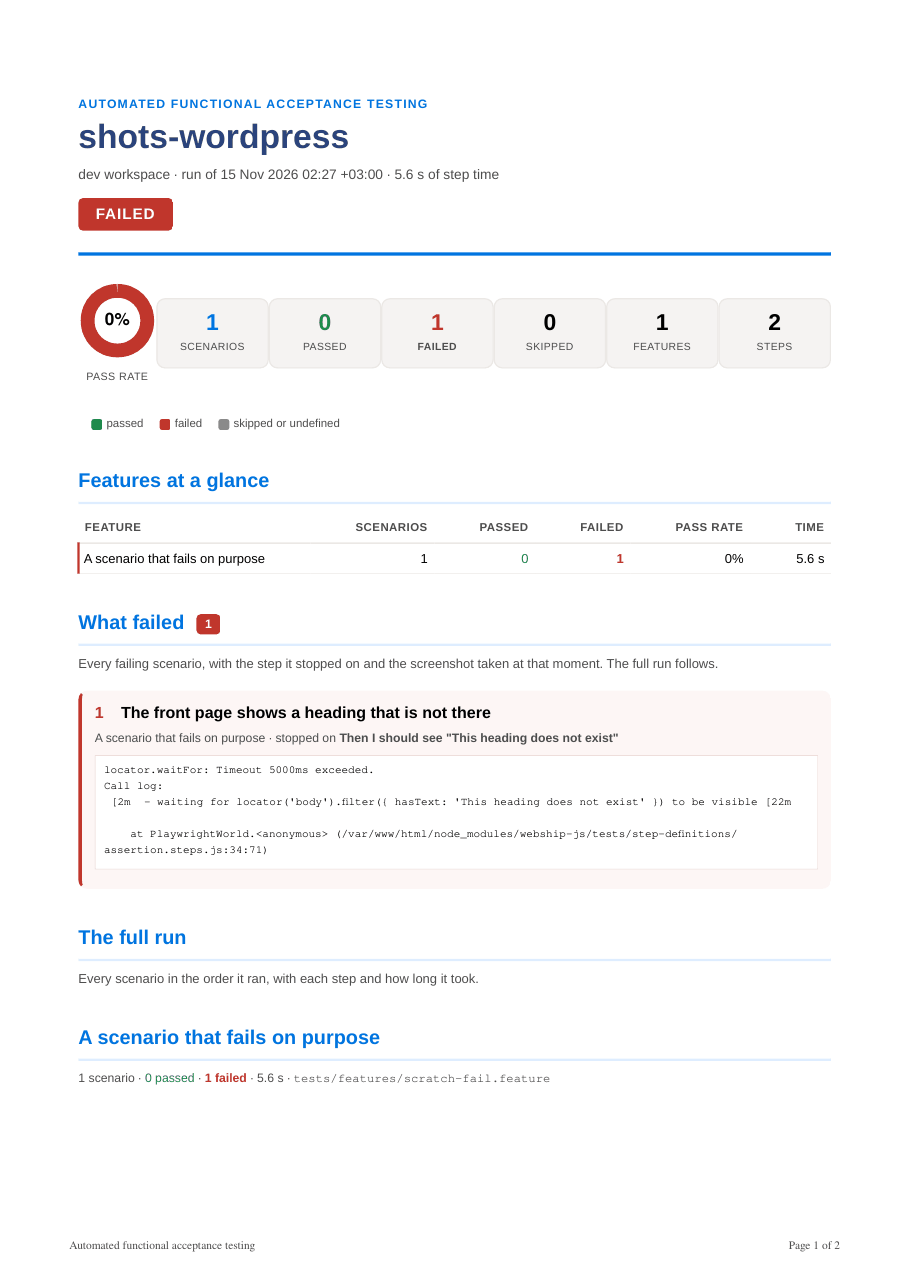
    The first page of the PDF report: Automated functional acceptance testing, shots-wordpress, FAILED, the pass rate and the counts of scenarios, features and steps, Features at a glance, What failed.

Watch a long run on Screens

  1. Open Screens in the header. Each running session is listed with its log and Open terminal.

    The Screens page with two sessions, a test run and a terminal, each with Open terminal and its log path, and the Playwright browsers running on the machine.

  2. Press Follow the log to read the output while it runs.
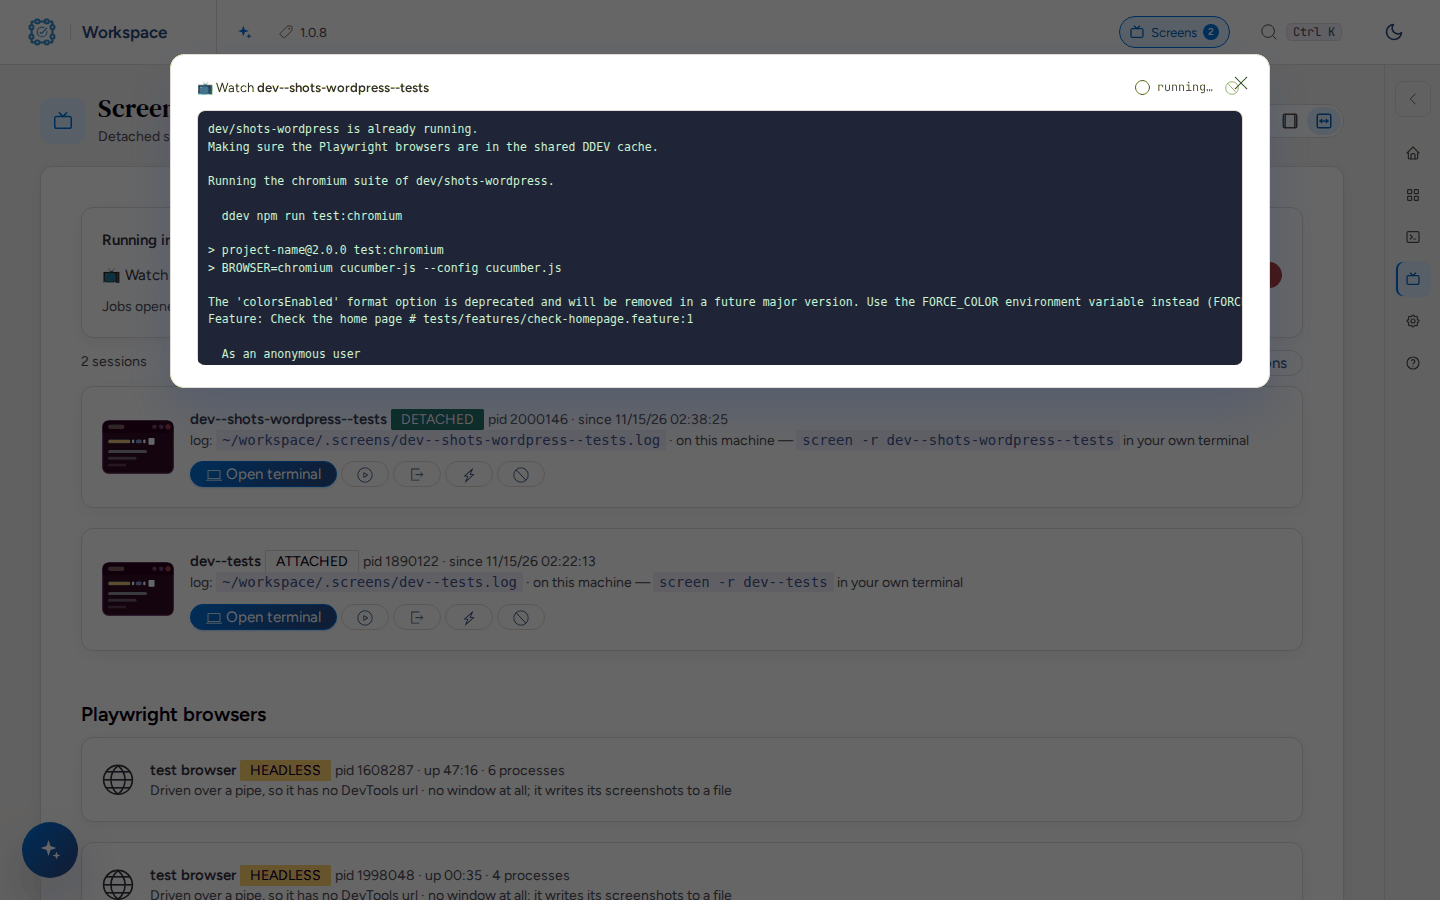
    A window over the Screens page following the log of the test run of shots-wordpress while it runs.

  3. Press Open terminal to work in the session from the browser.

    A terminal showing the end of plugins.sh --list: each plugin with its package, version and step (ready, or installed · next: configure).